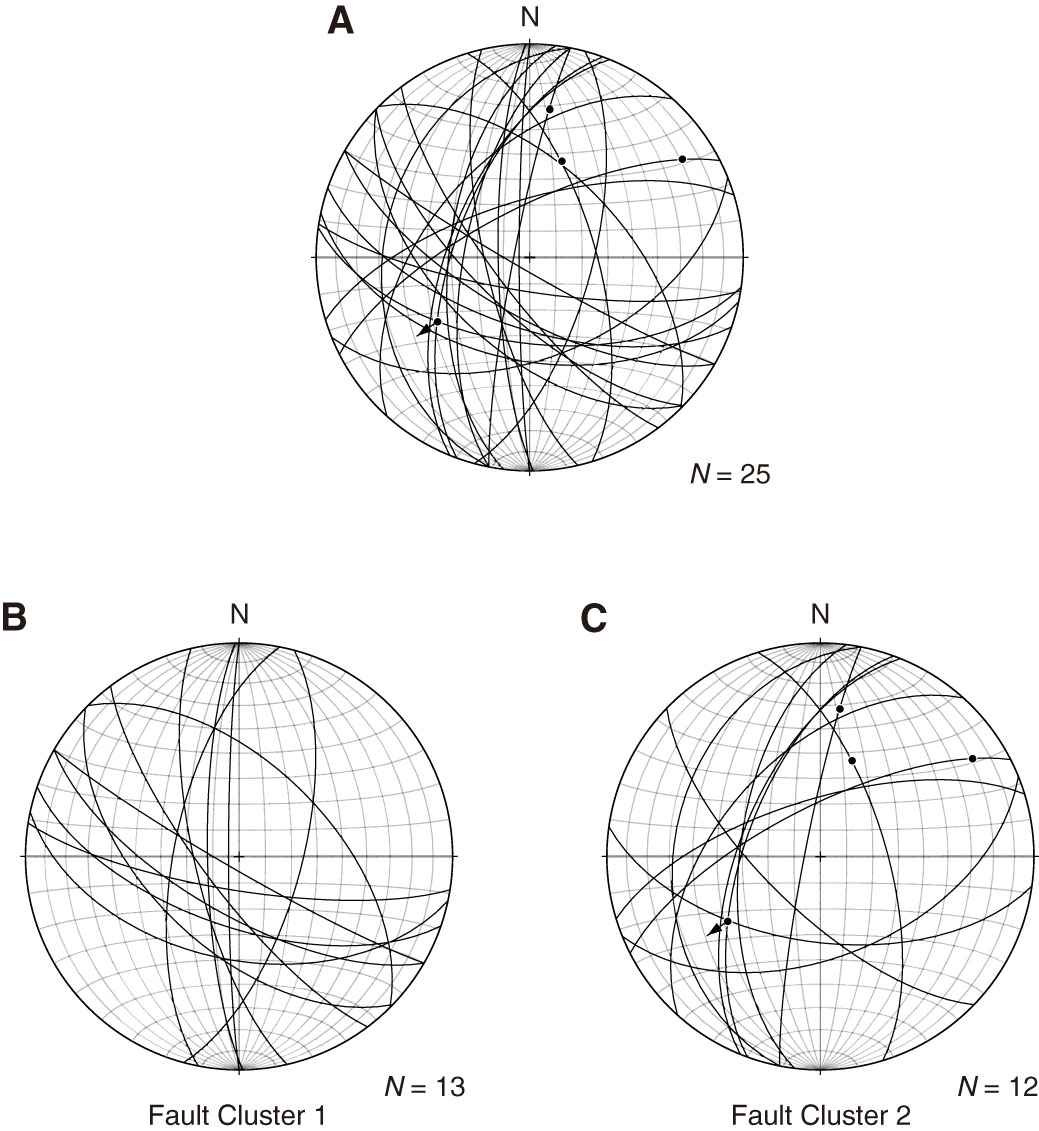
Figure F25. Lower-hemisphere equal-area projections of fault orientations in cores, Hole C0022B. Dots on great circles = striations, arrows = slip vectors of hanging wall relative to footwall. A. All measurements. B. Fault Cluster 1. C. Fault Cluster 2.
Previous | Close | Next | Top of page