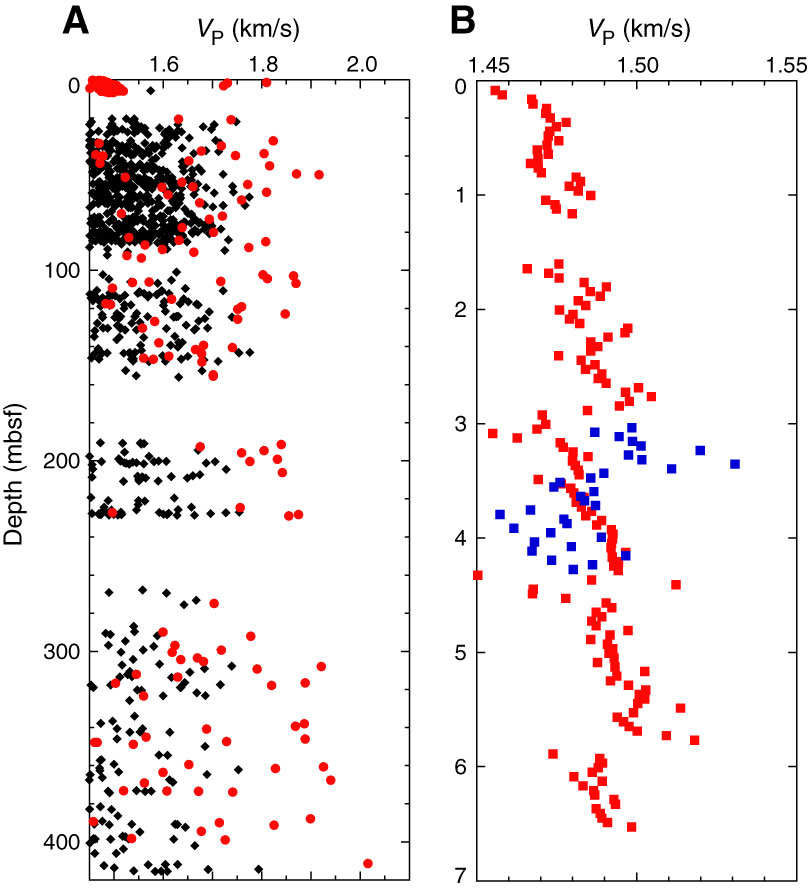
Figure F34. VP measurements. A. VP data from MSCL-W. Black = all recorded data, red = data filtered with P-wave amplitudes >30 mV. B. Comparison of VP measurements on Core 338-C0022-1H made by MSCL-W (red) and Section 338-C0022-1H-4 made by MSCL-S (blue).
Previous | Close | Next | Top of page