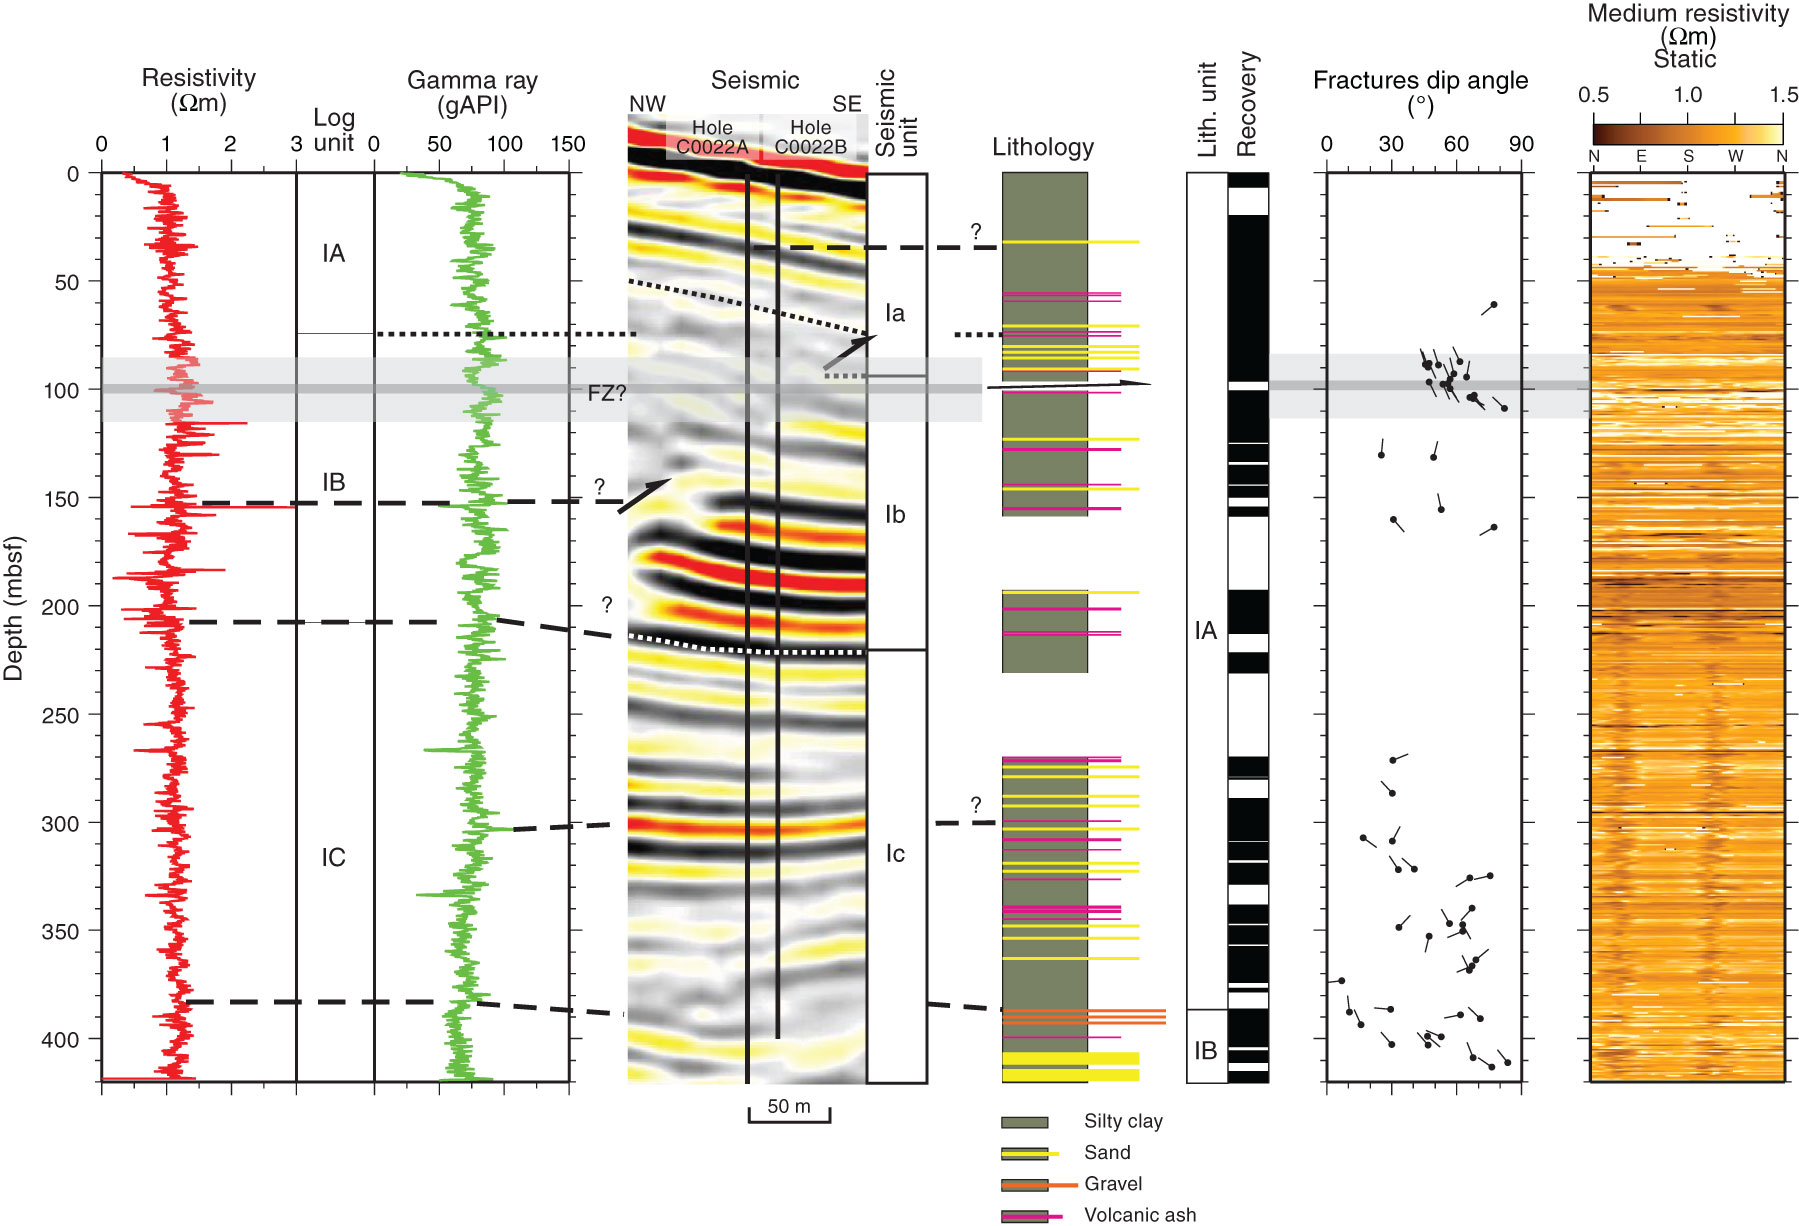
Figure F45. Core-log-seismic integration, Site C0022. LWD data from Hole C0022A, seismic data from In-line 2675 of the Kumano 3-D PSDM volume (Moore et al., 2009), core lithology from Hole C0022B (see “Lithology”), and tadpole plot of fracture dip angles and directions measured from resistivity images. Dashed black and dotted lines show correlations (? = tentative) between the different data sets. Shaded box highlights the fault zone (FZ) and wider deformation zone, as identified from fractures in resistivity images.
Previous | Close | Top of page