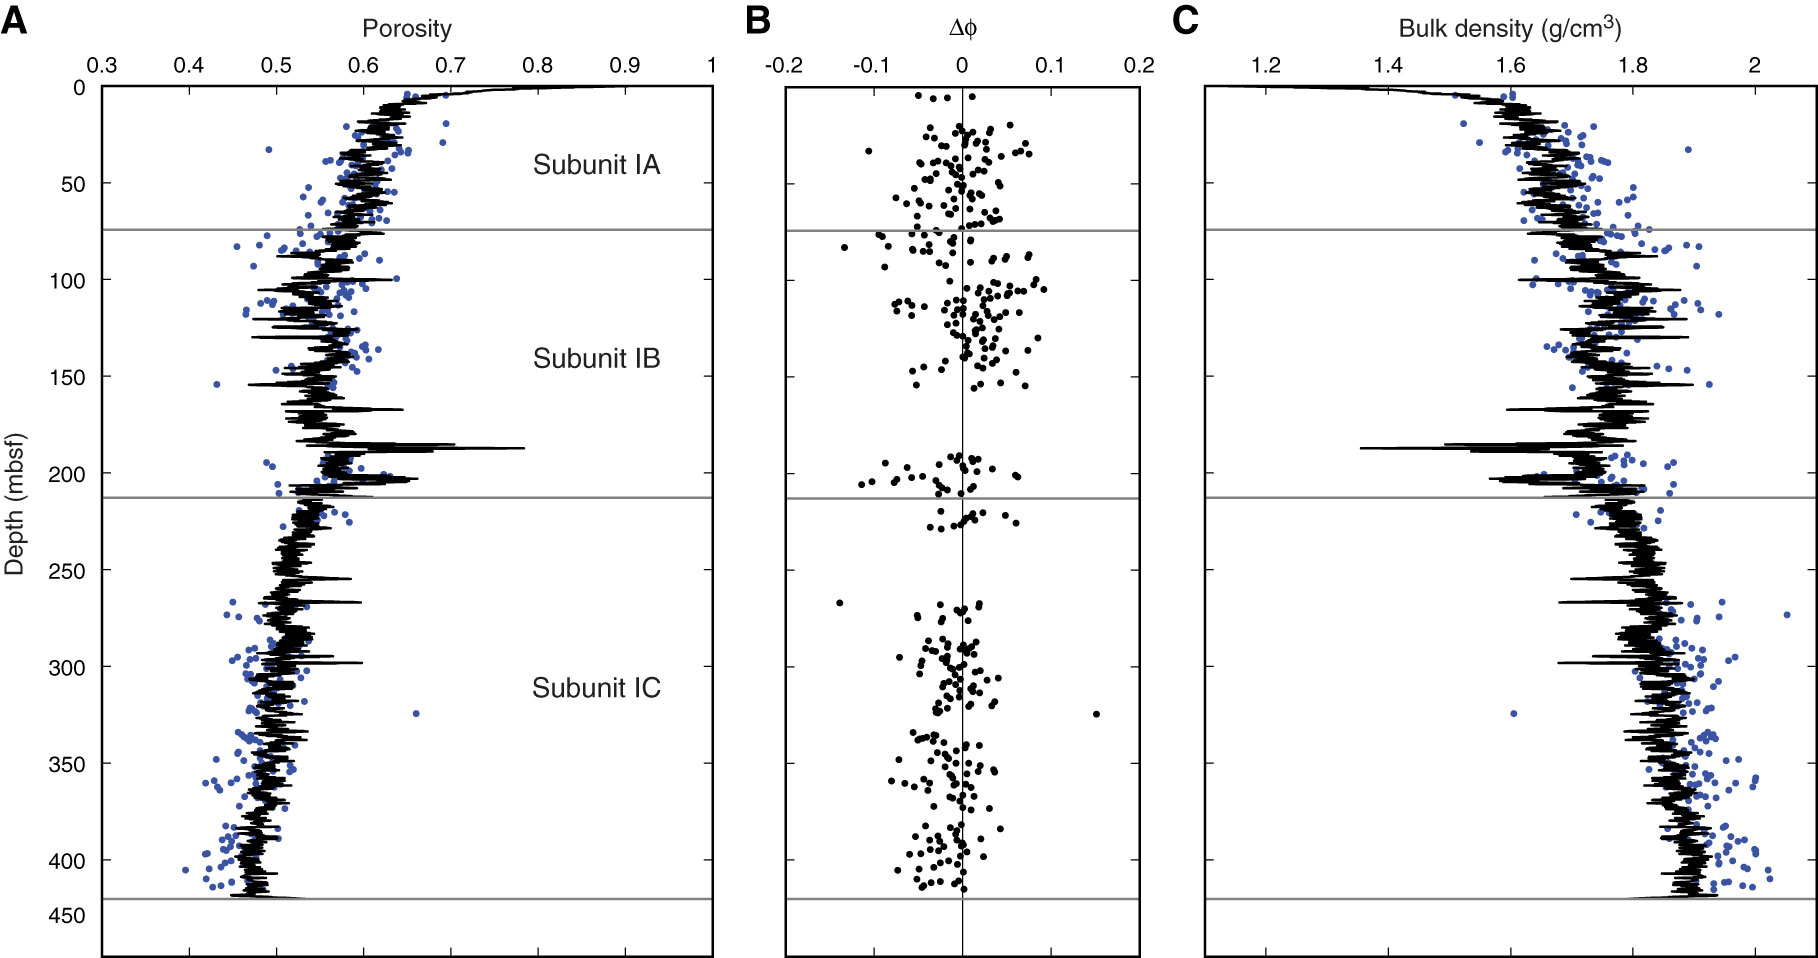
Figure F6. A. Resistivity-derived porosity (black line) plotted with MAD-derived porosity values (blue dots) from Hole C0022B. B. Offset (Δϕ = ϕMAD – ϕresistivity) between MAD-derived and resistivity-derived porosity data. C. Resistivity-derived bulk density (black line) plotted with MAD-derived bulk density data (blue dots). Resistivity-derived porosity and bulk density were calculated using Archie parameters of a = 1 and m = 2.4.
Previous | Close | Next | Top of page