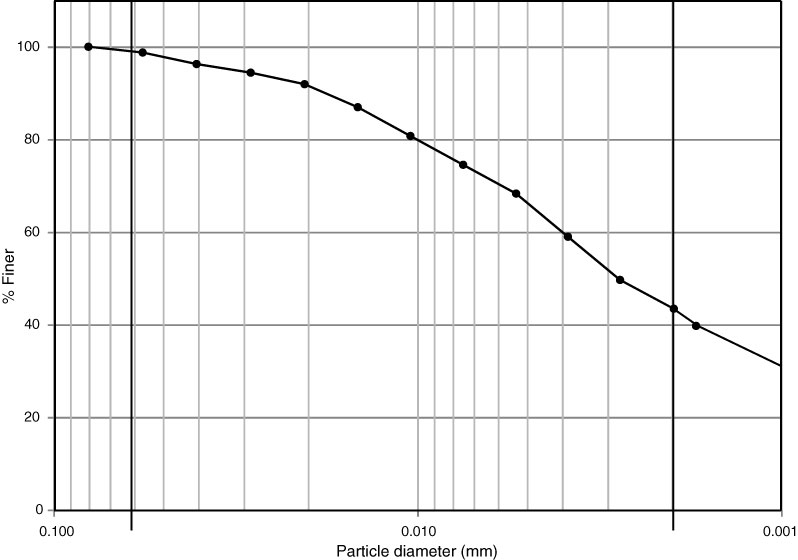
Figure F5. Sample particle size distribution plot on a semilog scale (Sample 338-C0021B-9H-8, 69–71 cm; 155.53 mbsf). Black dots = hydrometer readings. Sand/silt boundary is defined at 62.5 µm; silt/clay boundary is defined at 2 µm.
Previous | Close | Next | Top of page