Previous | Close | Next
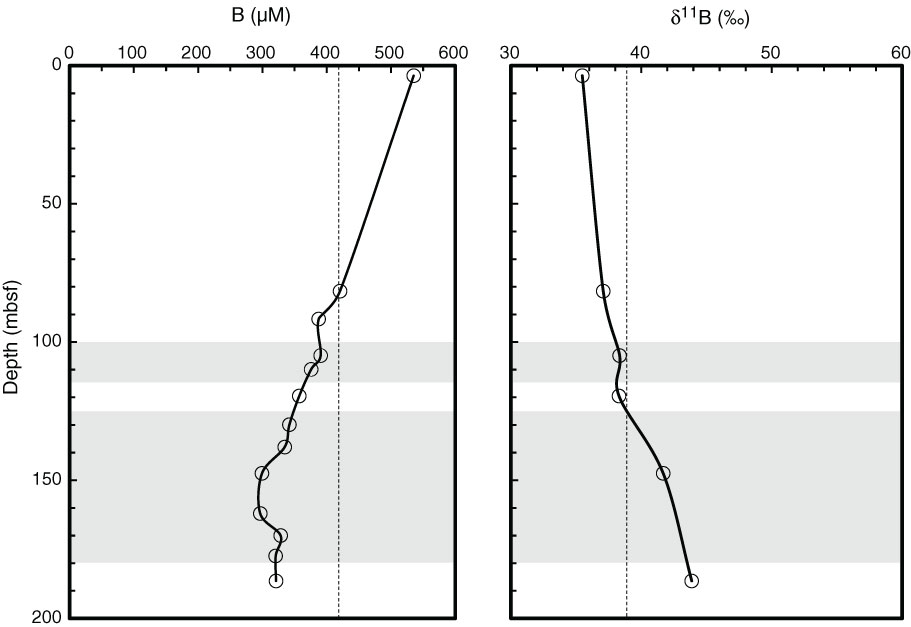
Figure F2. Depth profiles of total dissolved B concentration and δ11B, Site C0021. Shaded areas = mass transport deposits.
Previous | Close | Next | Top of page