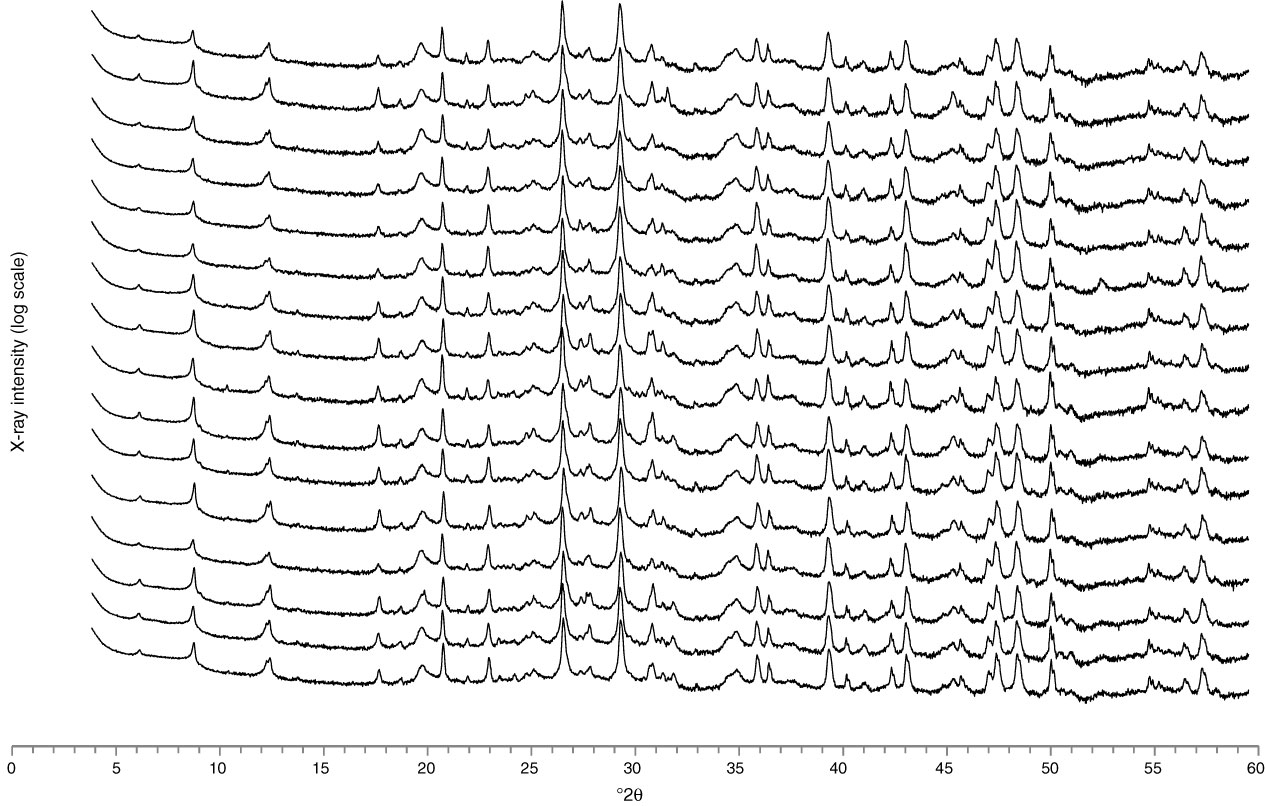
Figure F11. X-ray powder diffraction patterns from Holes U1385A and U1385B arranged with the shallowest sample at the top and the deepest sample at the bottom. The patterns are plotted with the intensity log to highlight the presence and nature of the smaller peaks. This figure shows that bulk mineralogy is nearly constant downhole, although minor changes occur in the intensities of the various peaks.
Previous | Close | Next | Top of page