Previous | Close | Next
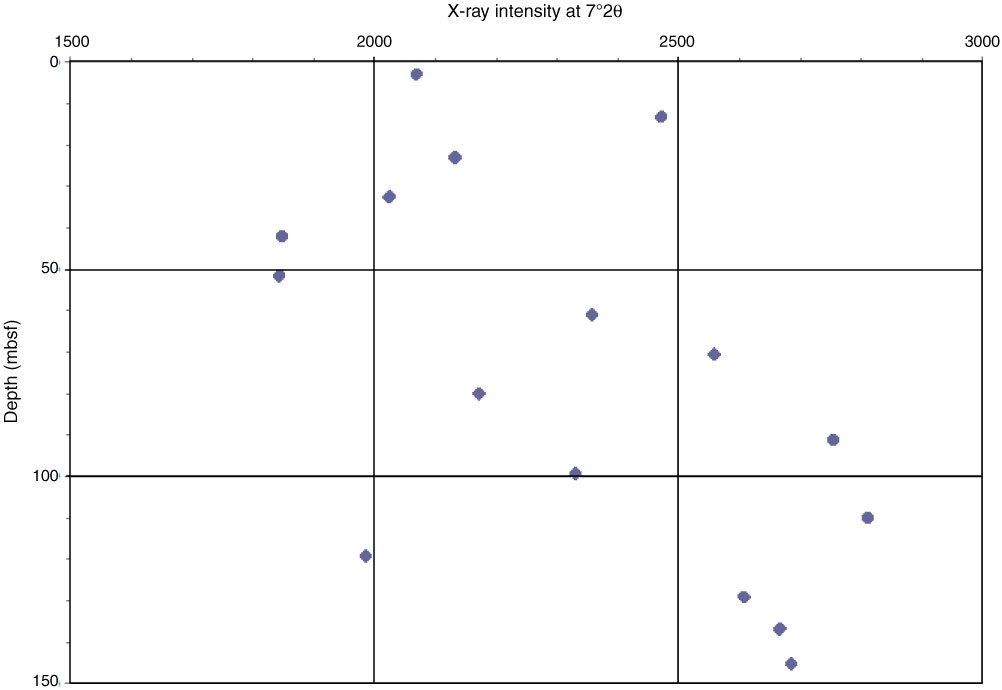
Figure F13. Scatter plot of X-ray intensity at 7°2θ plotted downhole, Site U1385. Note a general trend in increased intensity with increasing depth.
Previous | Close | Next | Top of page