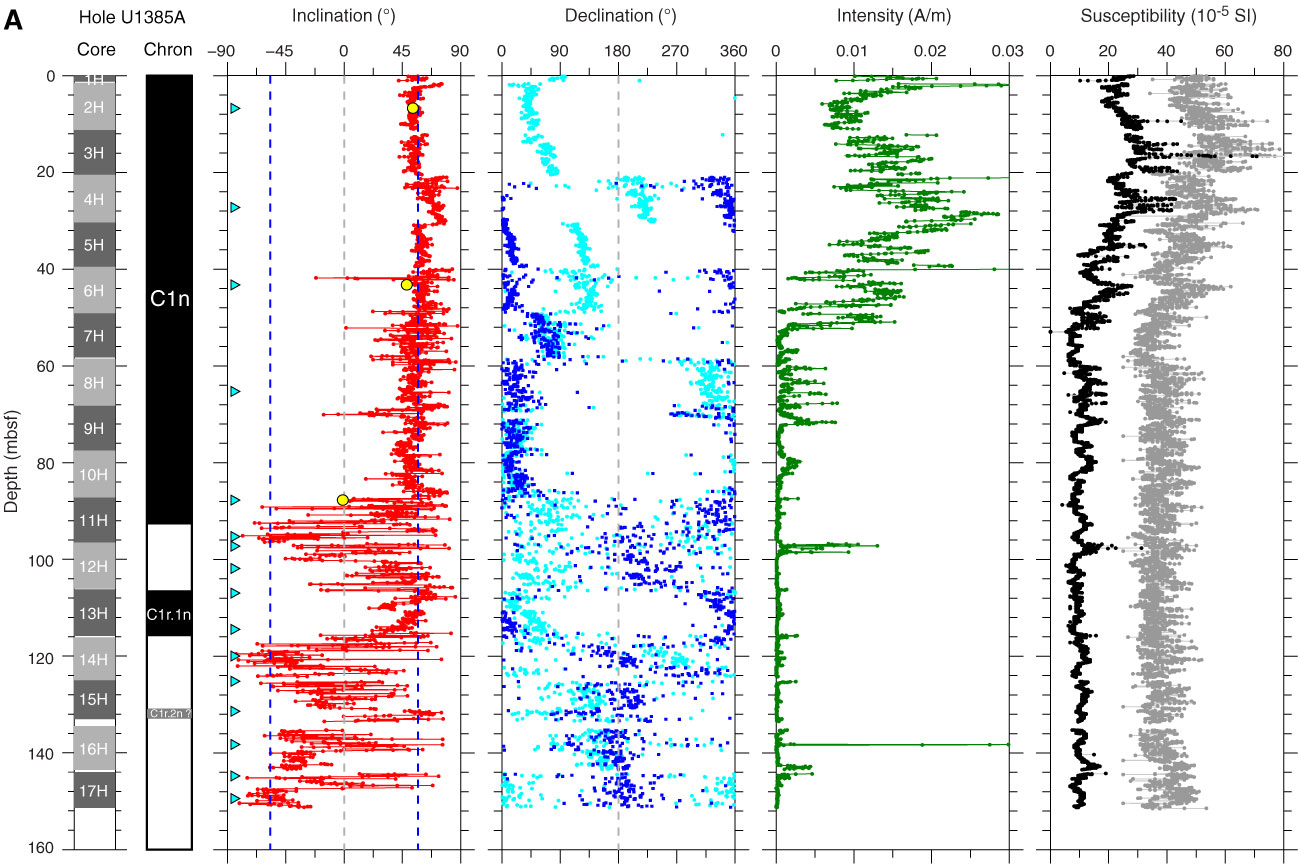
Figure F18. A–E. Paleomagnetism after 20 mT peak field AF demagnetization, Site U1385. Blue triangles = discrete sample locations. Yellow circles = component inclinations of discrete samples with maximum angular deviation less than ~15°. In Chron columns, black = normal polarity, white = reversed polarity, and gray = zones of possibly normal polarity (Cobb Mountain Subchron). In Inclination columns, blue dashed lines = expected GAD inclinations at the site latitude during reversed (left) and normal (right) polarities. In Declination columns, light blue circles = original declinations and dark blue squares = FlexIt tool–corrected declinations. In Susceptibility columns, gray lines represent SHMSL susceptibility plus 25 × 10–5 volume SI to better show the comparison with WRMSL susceptibility (black lines). A. Hole U1385A. (Continued on next four pages.)
Previous | Close | Next | Top of page