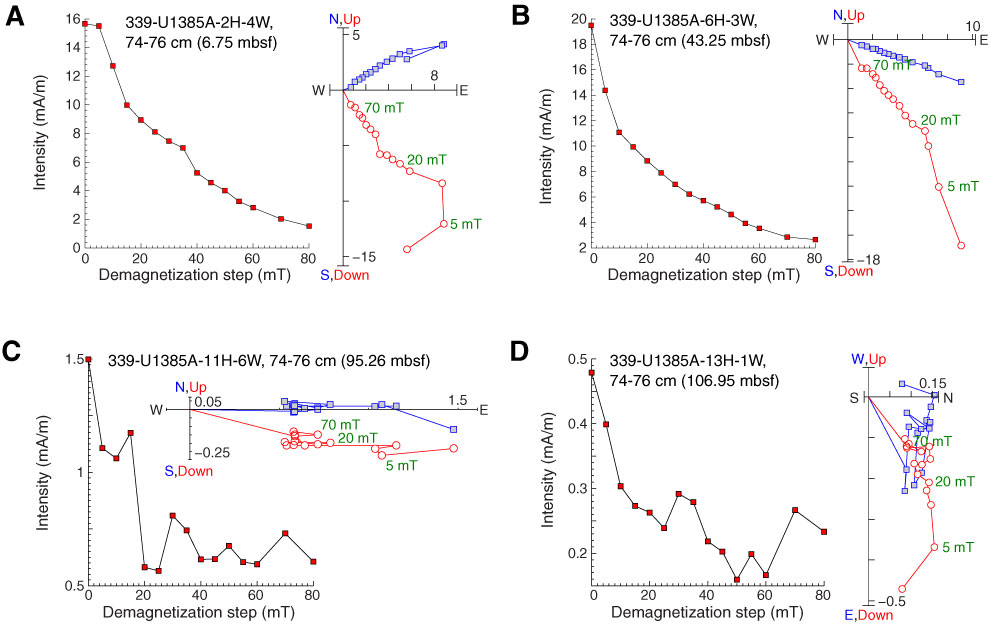
Figure F19. A–D. AF demagnetization results for four discrete samples, Hole U1385A. For each sample, the right plot shows the vector endpoints of paleomagnetic directions measured after each demagnetization treatment on an orthogonal projection (Zijderveld) plot. Squares = horizontal projections, circles = vertical projections. The left plot shows the intensity variation with progressive demagnetization. Orthogonal projection plots in A and B illustrate the removal of a steep drilling overprint by ~15–20 mT peak field AF demagnetization, with the remaining magnetization providing a well-resolved characteristic remanent magnetization. The weakly magnetized samples from below 50 mbsf (C and D) exhibit erratic behavior during demagnetization without a stable magnetic component.
Previous | Close | Next | Top of page