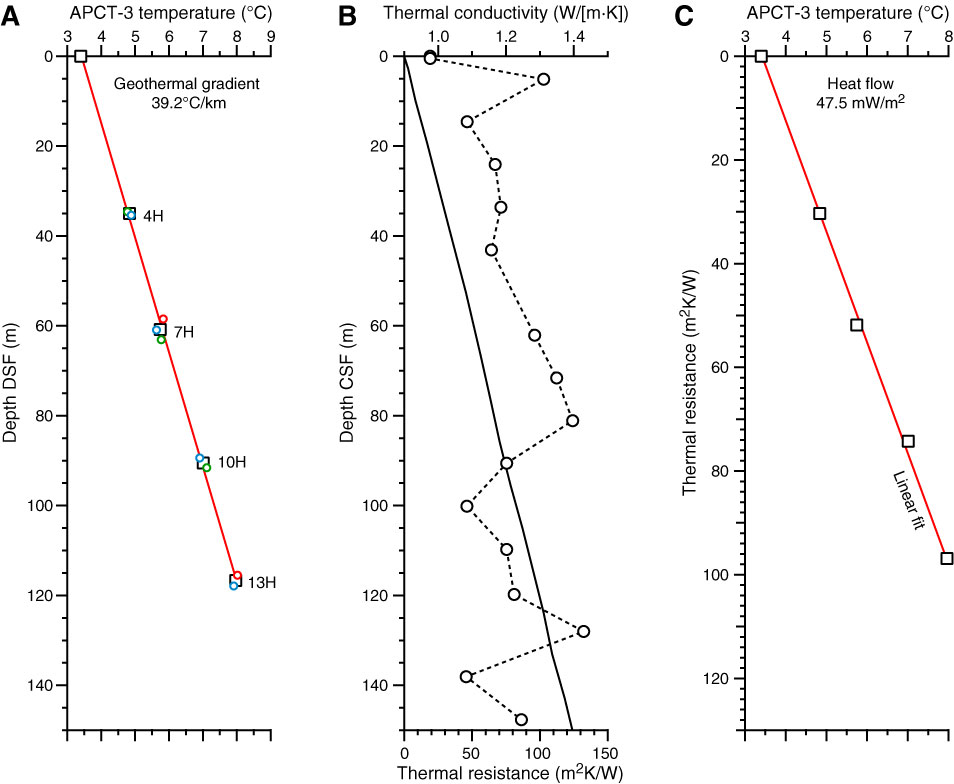
Figure F34. Plots of heat flow calculations, Site U1385. A. Sediment temperatures in Holes U1385A (red), U1385B (green), and U1385D (blue) with average values for Cores 4H, 7H, 10H, and 13H from each hole (black squares). B. Thermal conductivity data (circles) from Hole U1385A with calculated thermal resistance (solid line). C. Bullard plot in which heat flow is calculated from a linear fit of the temperature data.
Previous | Close | Next | Top of page