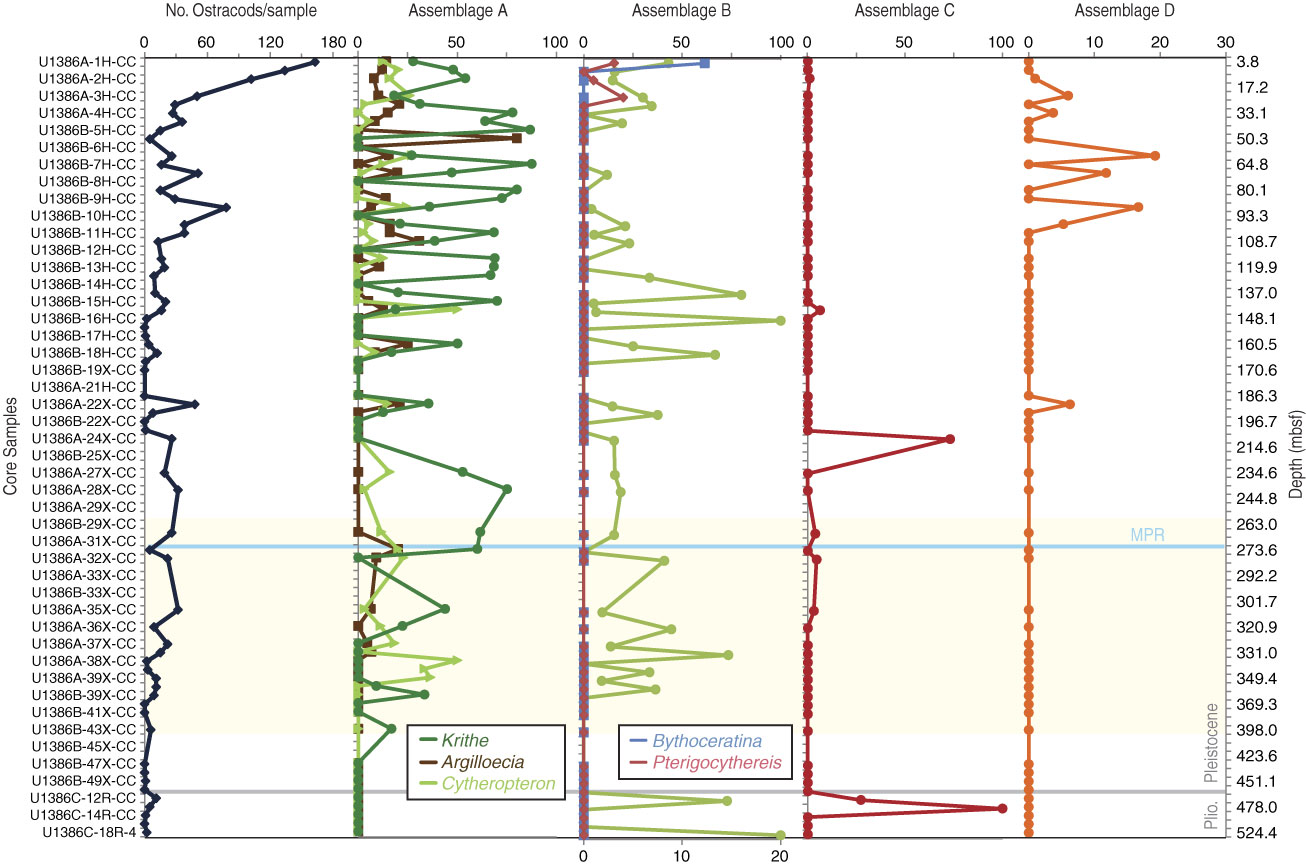
Figure F30. Stratigraphic distribution of ostracod abundance and ostracod assemblages at Site U1386. Downhole relative abundance of Assemblage B is indicated by the light green line and plotted on the scale in the upper x-axis. Relative abundances of Bythoceratina and Pterigocythereis are plotted on the lower x-axis. See text for details. Light yellow shaded area = Mid-Pleistocene Transition between 1.2 and 0.6 Ma. MPR = mid-Pleistocene revolution.
Previous | Close | Next | Top of page