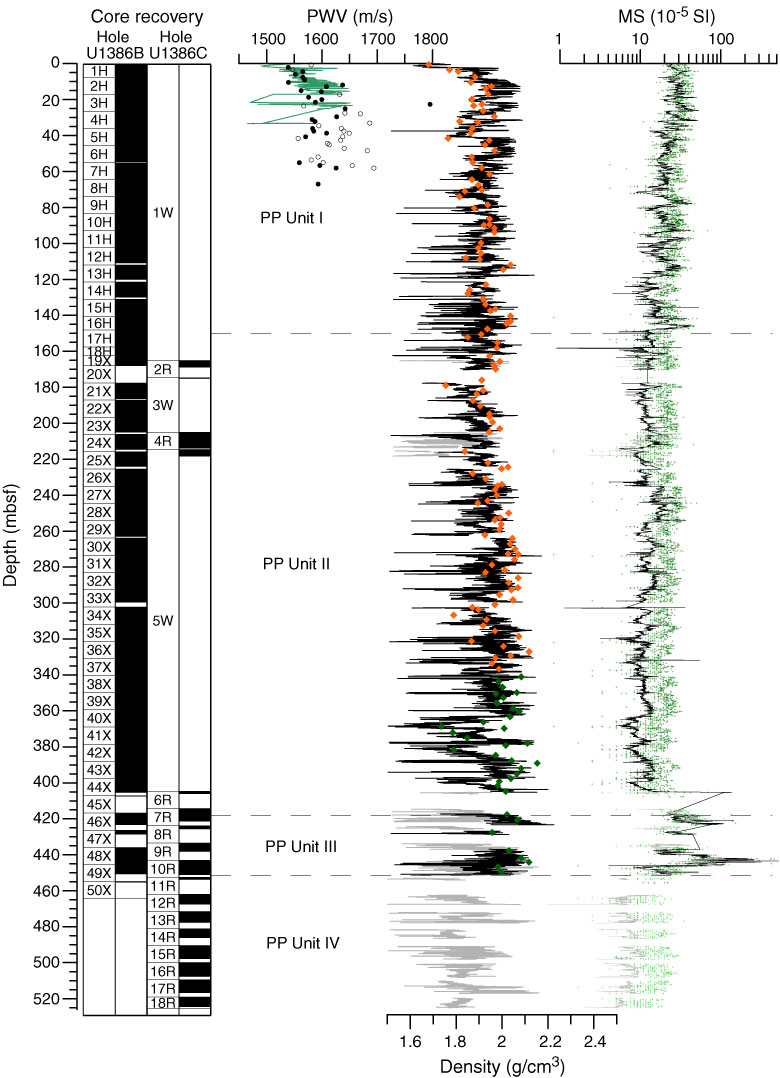
Figure F33. Plots of P-wave velocity (PWV) measured in Hole U1386B on the Whole-Round Multisensor Logger (WRMSL; green line) and Section Half Measurement Gantry (discrete samples) in automatic (solid circles) and manual (open circles) mode in Hole U1386A, wet bulk density measurements in Holes U1386A (red diamonds) and U1386B (green diamonds), gamma ray attenuation density measured on the WRMSL in Holes U1386B (black line) and U1386C (gray line), and magnetic susceptibility (MS) measured on the WRMSL in Holes U1386B (black line) and U1386C (gray line) and on split cores in Holes U1386B (green) and U1386C (light green). Note that records were cleaned for outliers and bad data at section ends, and susceptibility is plotted on a logarithmic scale to account for the high range of values. PP = physical properties.
Previous | Close | Next | Top of page