Previous | Close | Next
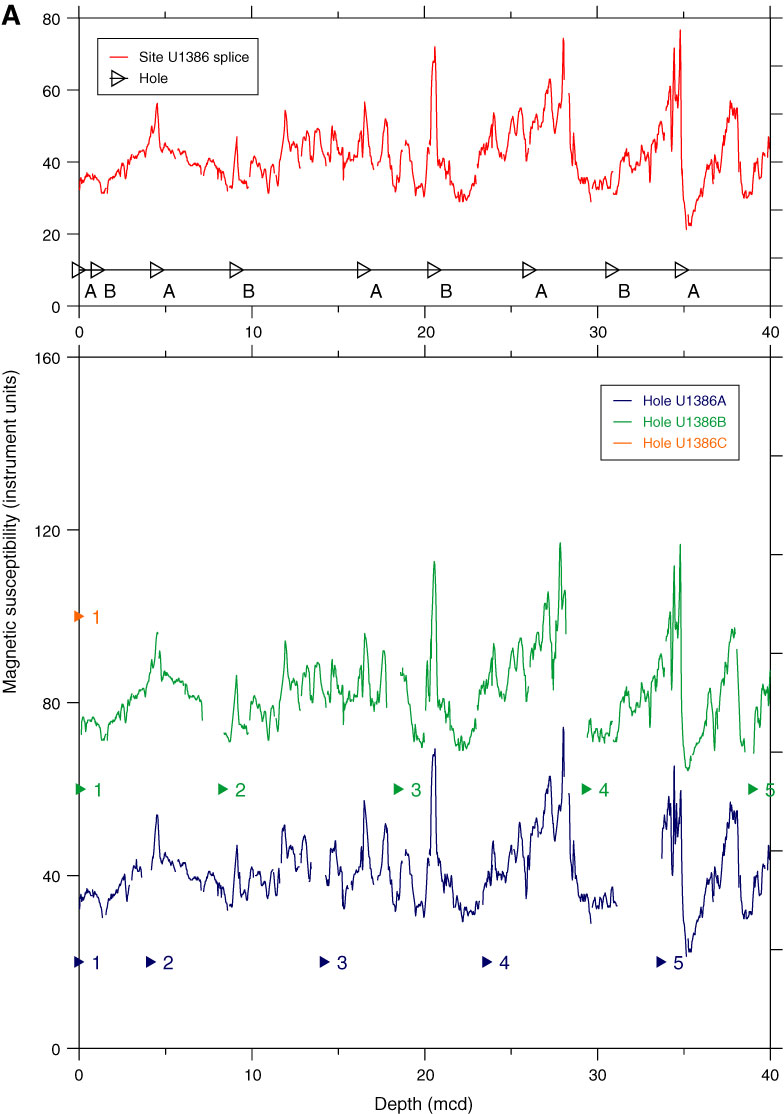
Figure F55. Plots of magnetic susceptibility vs. composite depth, Site U1386. A. 0–40 mcd. (Continued on next 14 pages.)
Previous | Close | Next | Top of page