Previous | Close
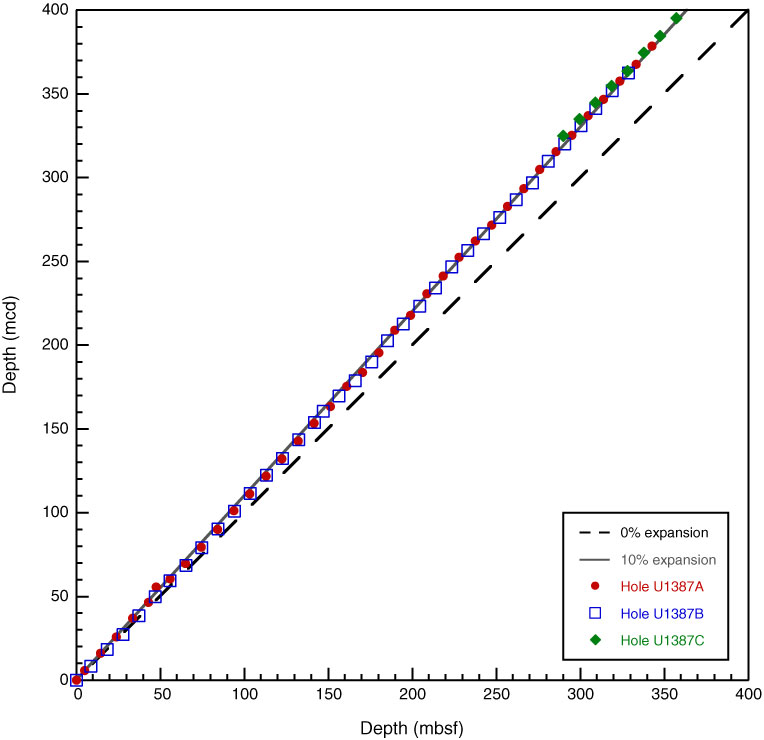
Figure F49. Plot of core top depths for mbsf vs. mcd. The best-fit line (not shown) is for 10.5% expansion.
Previous | Close | Top of page