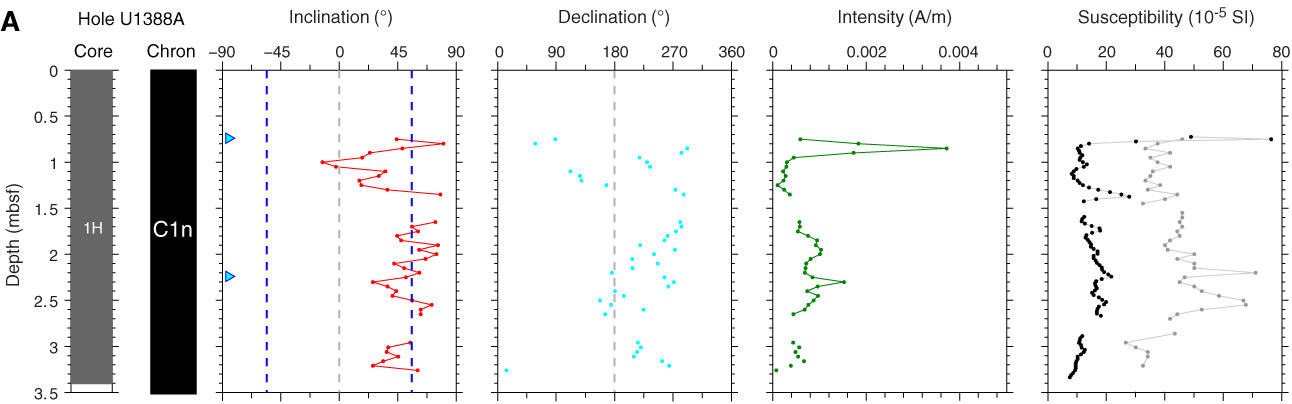
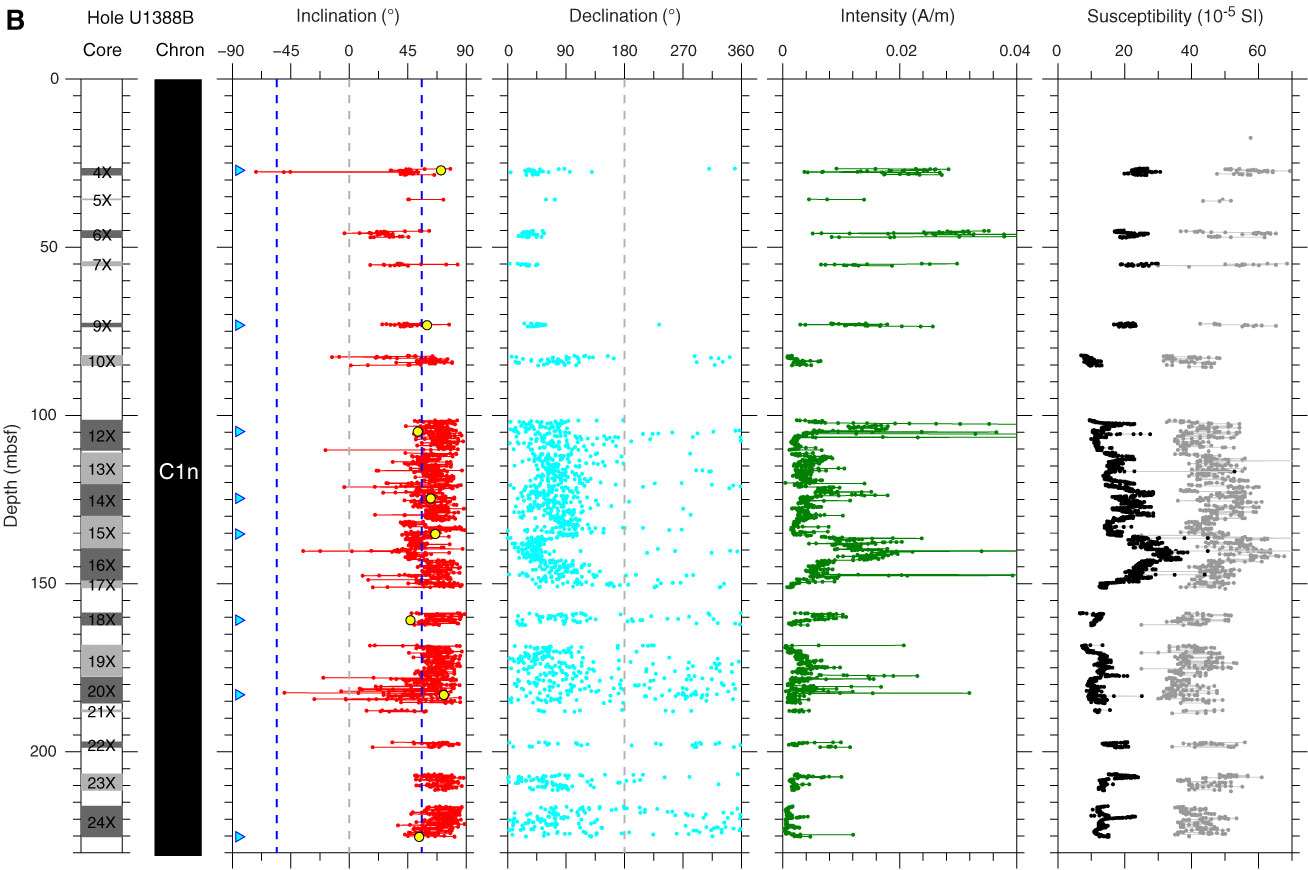
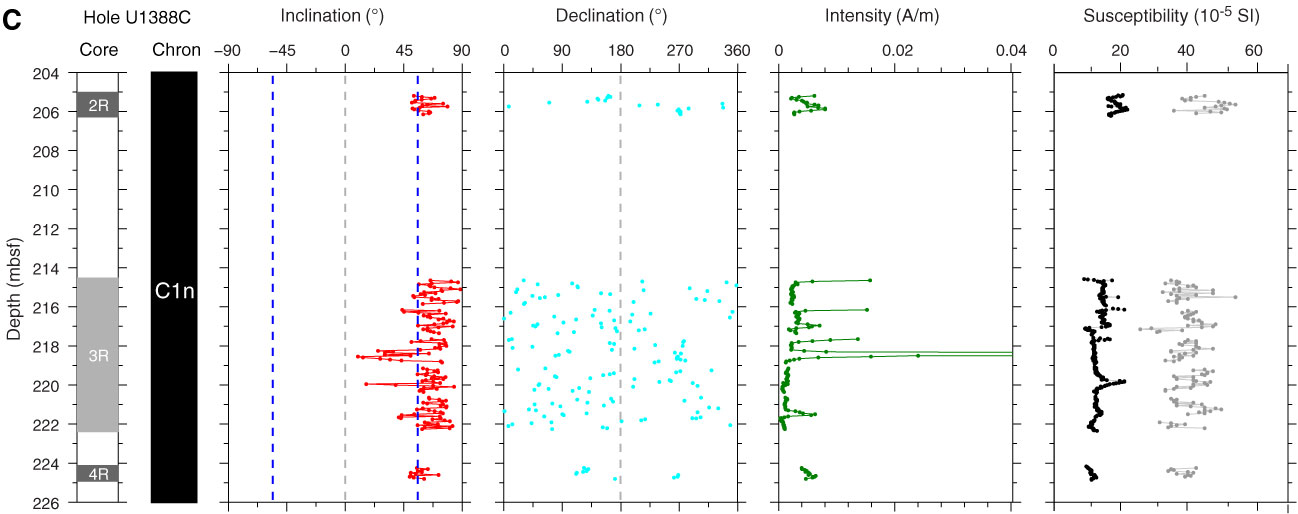
Figure F22. Paleomagnetism after 20 mT AF demagnetization, Site U1388. Blue triangles = discrete sample locations. Yellow circles = component inclinations of discrete samples with maximum angular deviation mostly less than 10°. In Chron columns, black = normal polarity, white = reversed polarity, and gray = zones without a clear magnetostratigraphic interpretation. In Inclination columns, blue dashed lines = expected geocentric axial dipole inclinations at the site latitude during reversed (left) and normal (right) polarities. In Susceptibility columns, gray lines indicate SHMSL susceptibility plus 25 × 10–5 volume SI to better show the comparison with WRMSL susceptibility (black lines). A. Hole U1365A. B. Hole U1388B. C. Hole U1388C.
Previous | Close | Next | Top of page