Previous | Close | Next
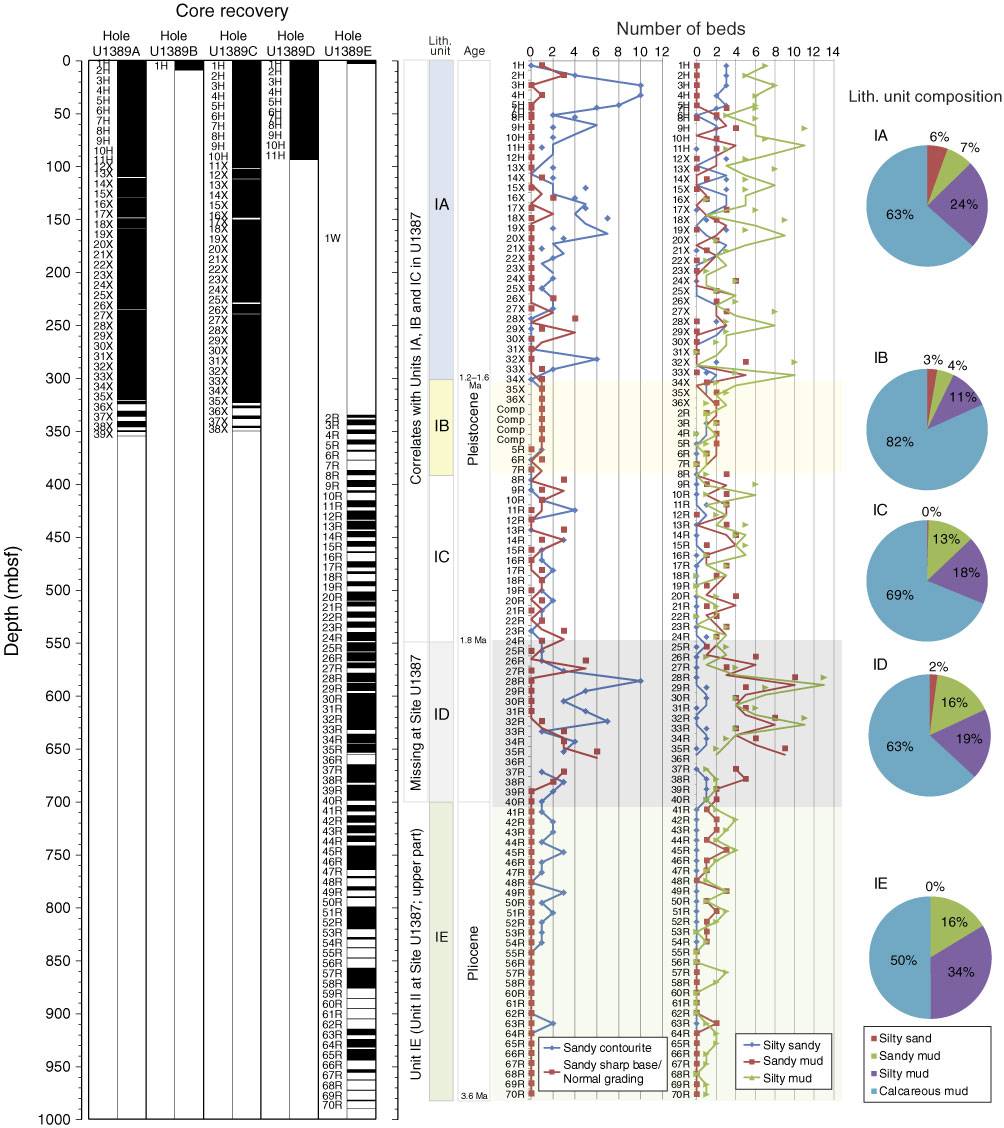
Figure F10. Plot showing downhole trends in the number and composition of beds, Site U1389.
Previous | Close | Next | Top of page