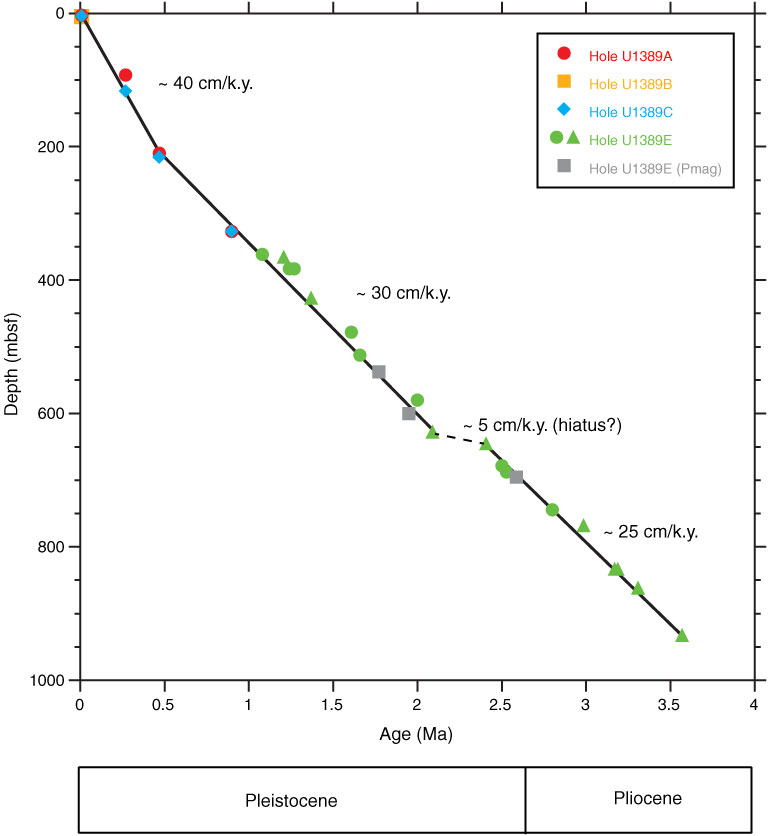
Figure F21. Biostratigraphic events vs. depth, Site U1389. Events are plotted at their mean depth (Table T7). For Hole U1389E, circles are calcareous nannofossil datums, triangles are planktonic foraminifer events, and gray squares are ages for the Olduvai Subchron and Gauss/Matuyama boundary (see “Paleomagnetism”).
Previous | Close | Next | Top of page