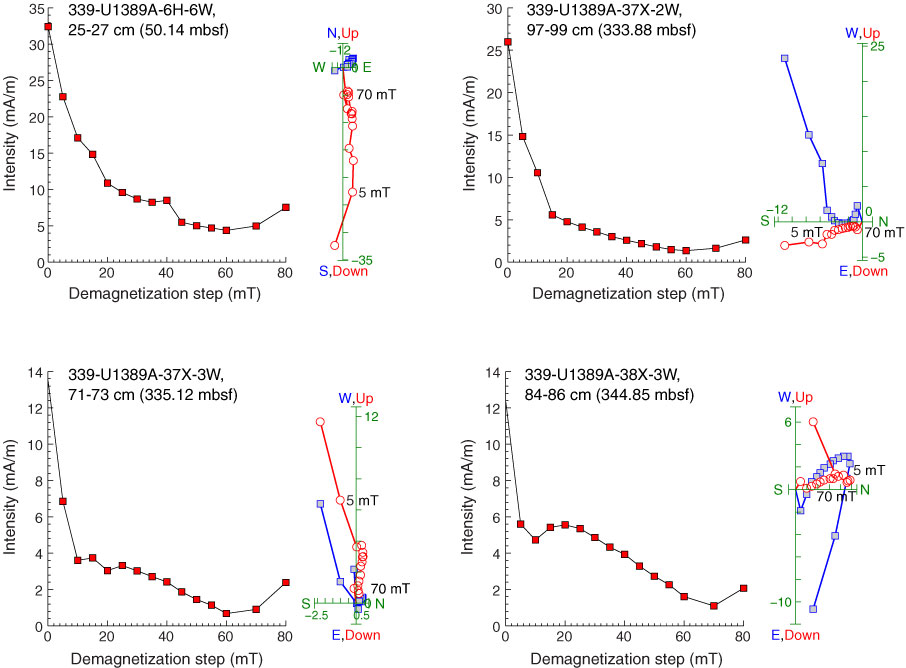
Figure F24. AF demagnetization results for four discrete samples, Site U1389. For each sample, the right plot shows the vector endpoints of paleomagnetic directions measured after each demagnetization treatment on an orthogonal projection (Zijderveld) plot. Squares = horizontal projections, circles = vertical projections. The left plot shows the intensity variation with progressive demagnetization. Orthogonal projection plots illustrate the removal of a steep drilling overprint by ~15–20 mT peak field AF demagnetization and a significant amount of ARM acquisition during high-peak field (greater than ~55 mT) AF demagnetization, with the remaining magnetization providing a well-resolved characteristic remanent magnetization.
Previous | Close | Next | Top of page