Previous | Close | Next
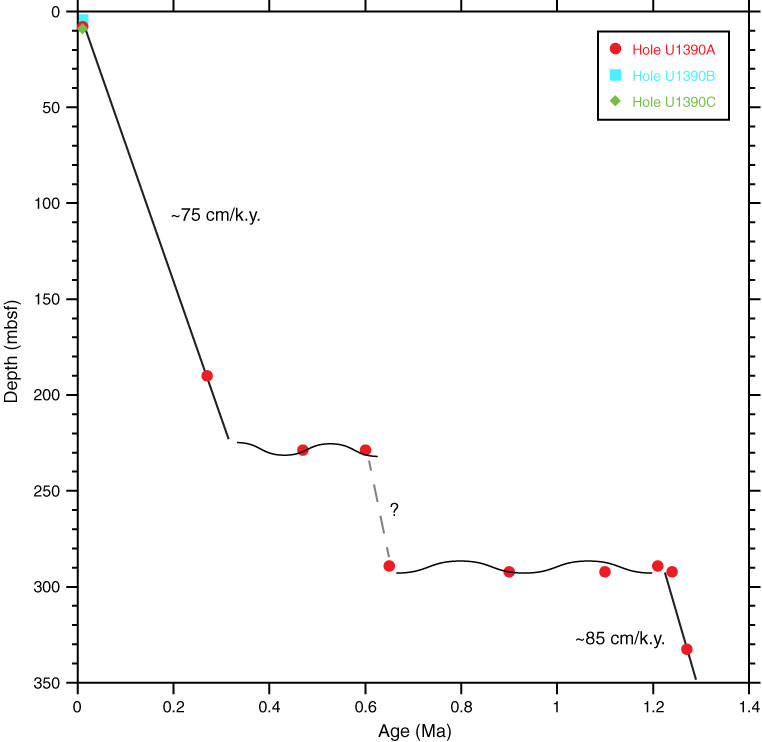
Figure F20. Biostratigraphic events vs. depth, Site U1390. Events are plotted at their mean depth (Table T6). Wavy lines = hiatus positions.
Previous | Close | Next | Top of page