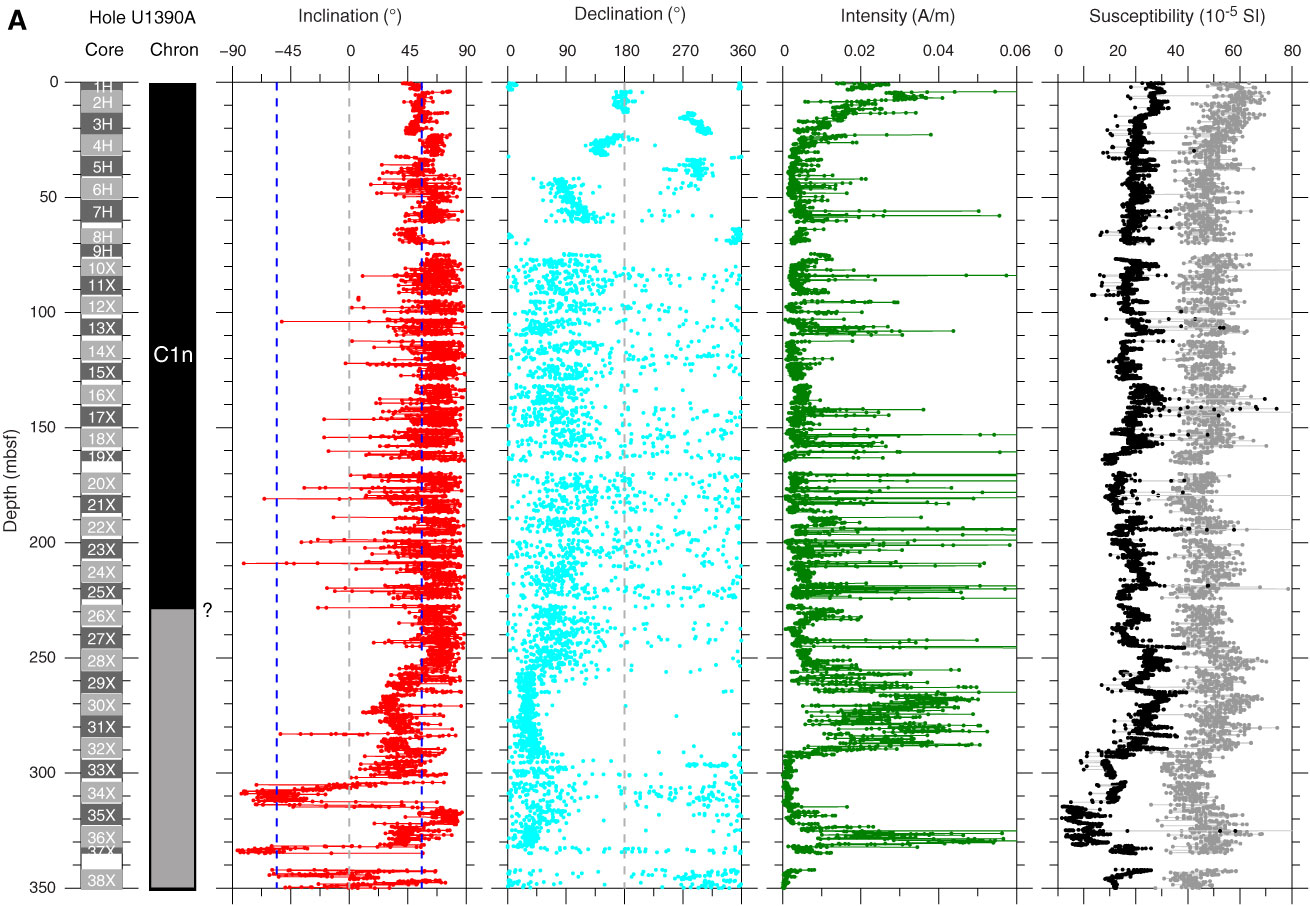
Figure F22. Paleomagnetism after 20 mT AF demagnetization, Site U1390. In the Chron columns, black = normal polarity, white = reversed polarity, and gray = zones or polarity boundaries without a clear magnetostratigraphic interpretation. In Inclination columns, blue dashed lines = expected geocentric axial dipole inclinations at the site latitude during reversed (left) and normal (right) polarities. In Declination columns, light blue circles = measured declinations and dark blue circles = FlexIt tool–corrected declinations. In Susceptibility columns, gray lines represent SHMSL susceptibility plus 25 × 10–5 volume SI to better show the comparison with WRMSL susceptibility (black lines). A. Hole U1390A. (Continued on next two pages.)
Previous | Close | Next | Top of page