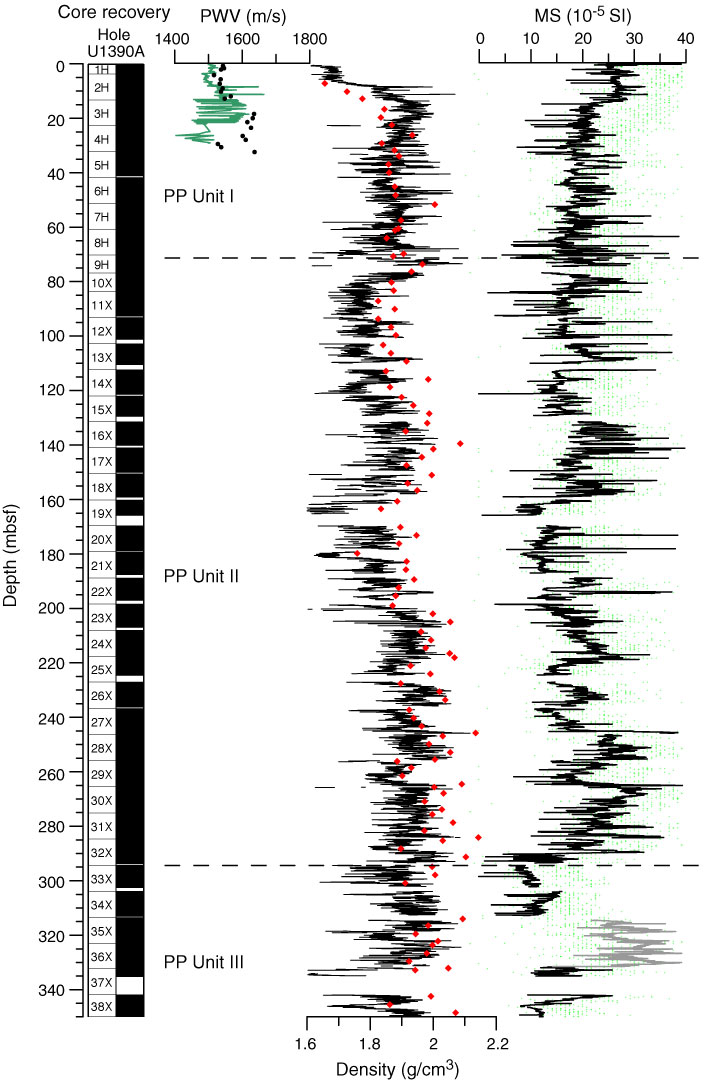
Figure F23. Plots of P-wave velocity (PWV) measured in Hole U1390A on the Whole-Round Multisensor Logger (WRMSL; green line) and Section Half Measurement Gantry (discrete samples) set to automatic (solid circles) and manual (open circles) mode, wet bulk density (red diamonds) on discrete samples and gamma ray attenuation density measured on the WRMSL (black line), magnetic susceptibility (MS) measured on the WRMSL (black line) and on split cores (green points). Gray lines for magnetic susceptibility (Cores 339-U1390A-35X and 36X) are measurements obtained with incorrect zero calibration (offset of –30 × 10–5 SI from standard) that have been corrected by adding 30 × 10–5 SI, in agreement with magnetic susceptibility determined on split cores. Note that records were cleaned for outliers and bad data at sections ends. PP = physical property.
Previous | Close | Next | Top of page