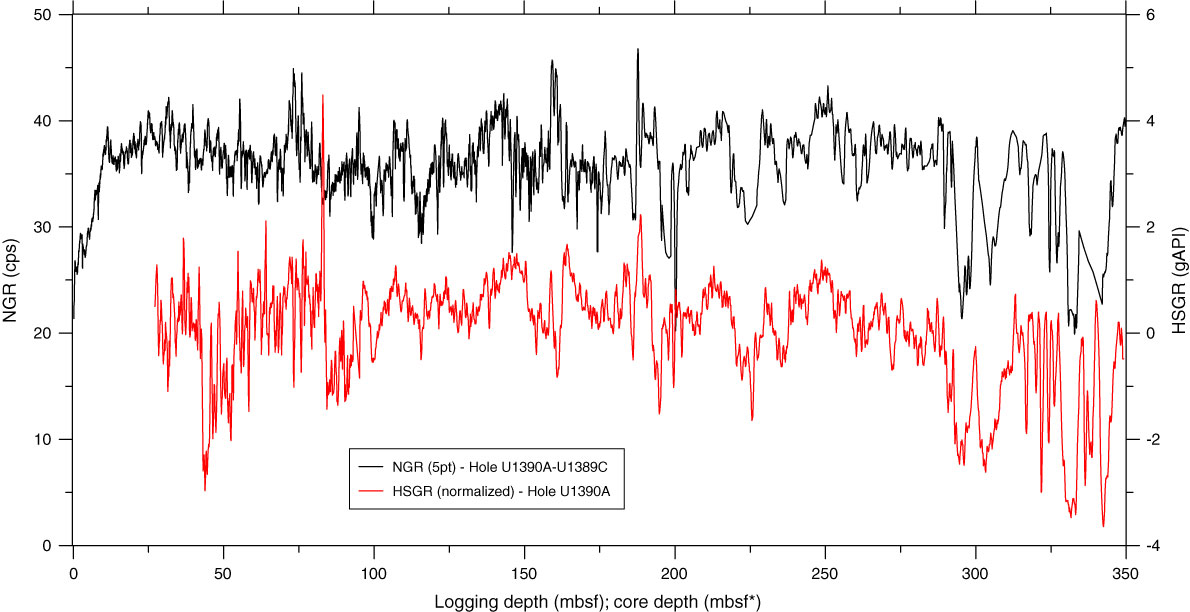
Figure F39. Plot of comparison between the logging standard (total) gamma ray (HSGR) data in Holes U1390A and U1390C and the (five-point average) natural gamma ray (NGR) data in Holes U1390A–U1390C vs. depth. HSGR data has been normalized separately for the interval below and above the end of the drill string.
Previous | Close | Next | Top of page