Previous | Close
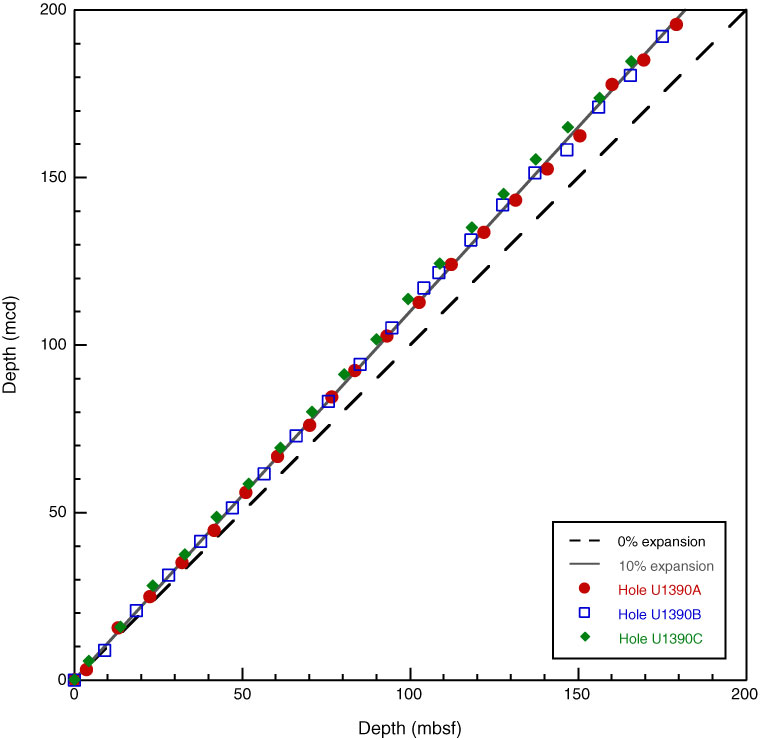
Figure F47. Plot of core top depths for mbsf vs. mcd. The best-fit line (not shown) through all data is for 9.9% expansion, and the expansion for individual Holes U1390A–U1390C are 9.4%, 10.1%, and 12.8%, respectively.
Previous | Close | Top of page