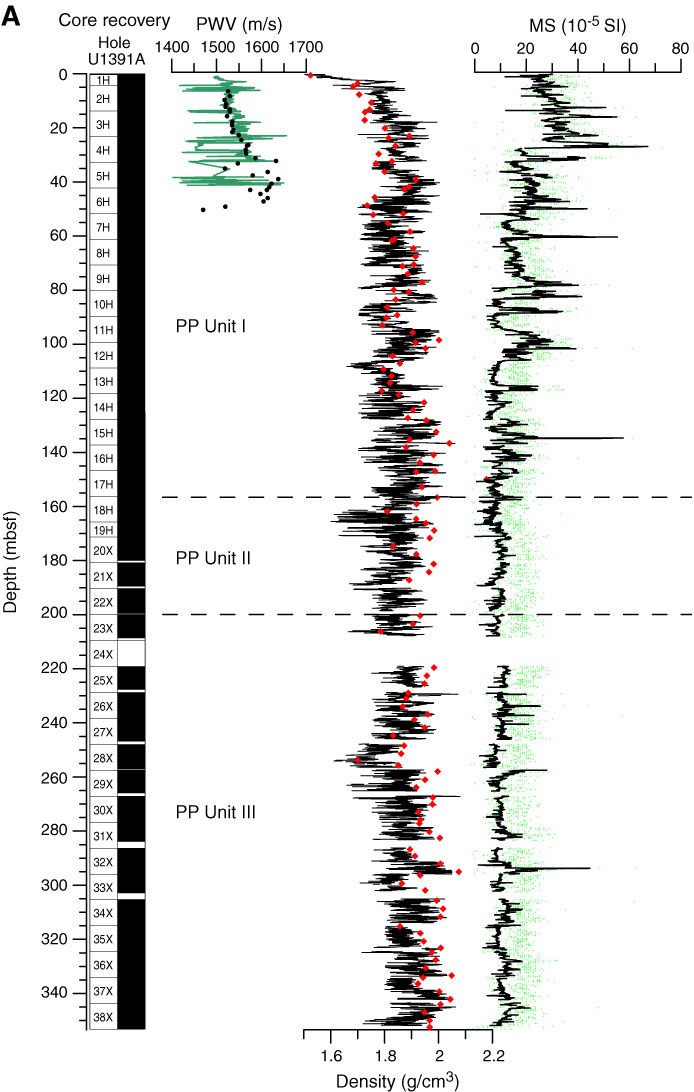
Figure F21. Plots of P-wave velocity (PWV) measured on the Whole Round Multisensor Logger (WRMSL; green line) and Section-Half Measurement Gantry (discrete samples) set to automatic (solid circles) and manual (open circles) mode, wet bulk density obtained on discrete samples (red diamonds), gamma ray attenuation density measured on the WRMSL (black lines), and magnetic susceptibility (MS) measured on the WRMSL (black lines) and on split cores (green points). Note that records were cleaned for outliers and bad data at sections ends. PP = physical property. A. Hole U1391A. (Continued on next page.)
Previous | Close | Next | Top of page