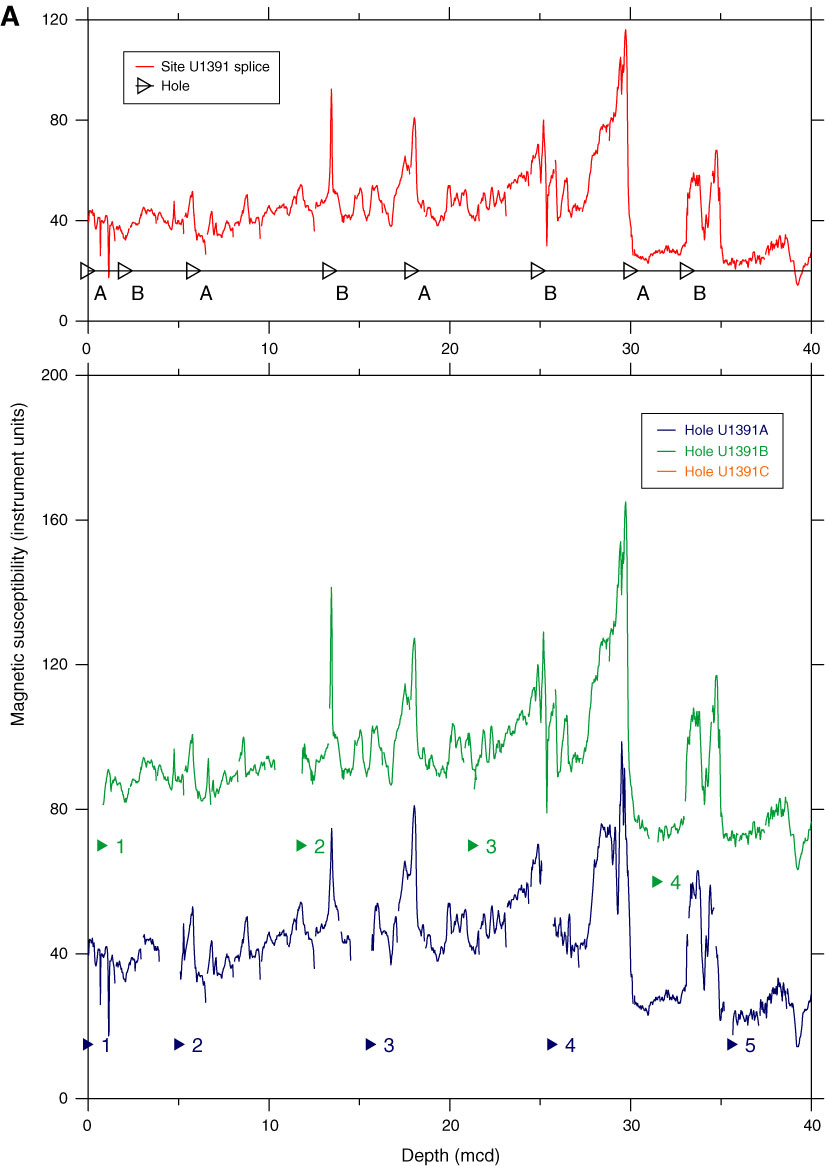
Figure F40. Plots of magnetic susceptibility vs. composite depth, Site U1391. In the lower panel, susceptibility values for Holes U1391B and U1391C are shifted for display purposes. A. 0–40 mcd. (Continued on next 10 pages.)
Previous | Close | Next | Top of page