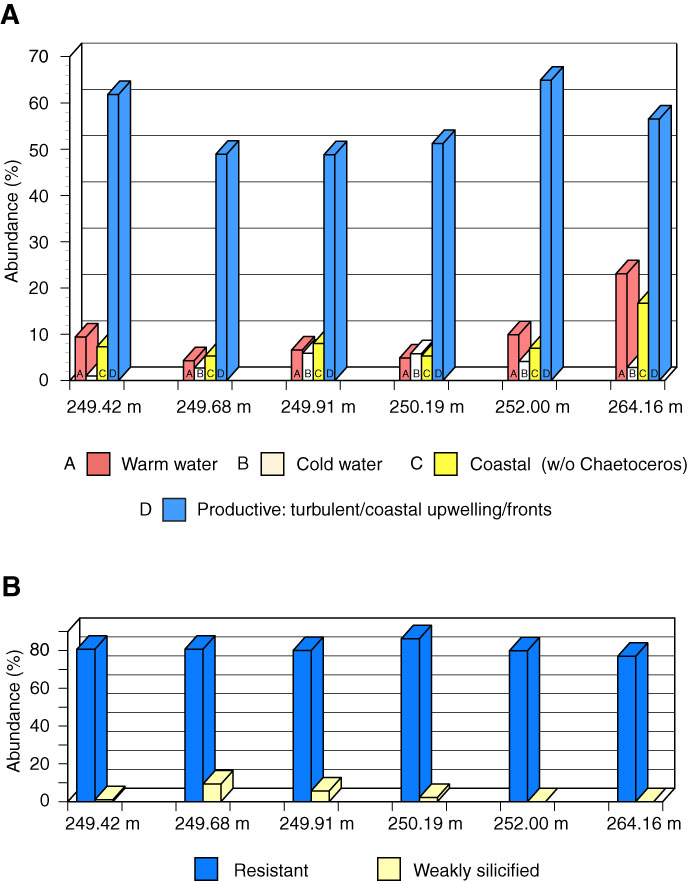
Figure F3. A. Diatom dominant species and ecological groups distribution within the 6 samples containing diatoms. In two samples, the number of diatom specimens encountered in 3 slides was <95; therefore, their assemblage composition is not considered. B. Contribution of resistant and weakly silicified diatoms.
Previous | Close | Next | Top of page