Previous | Close | Next
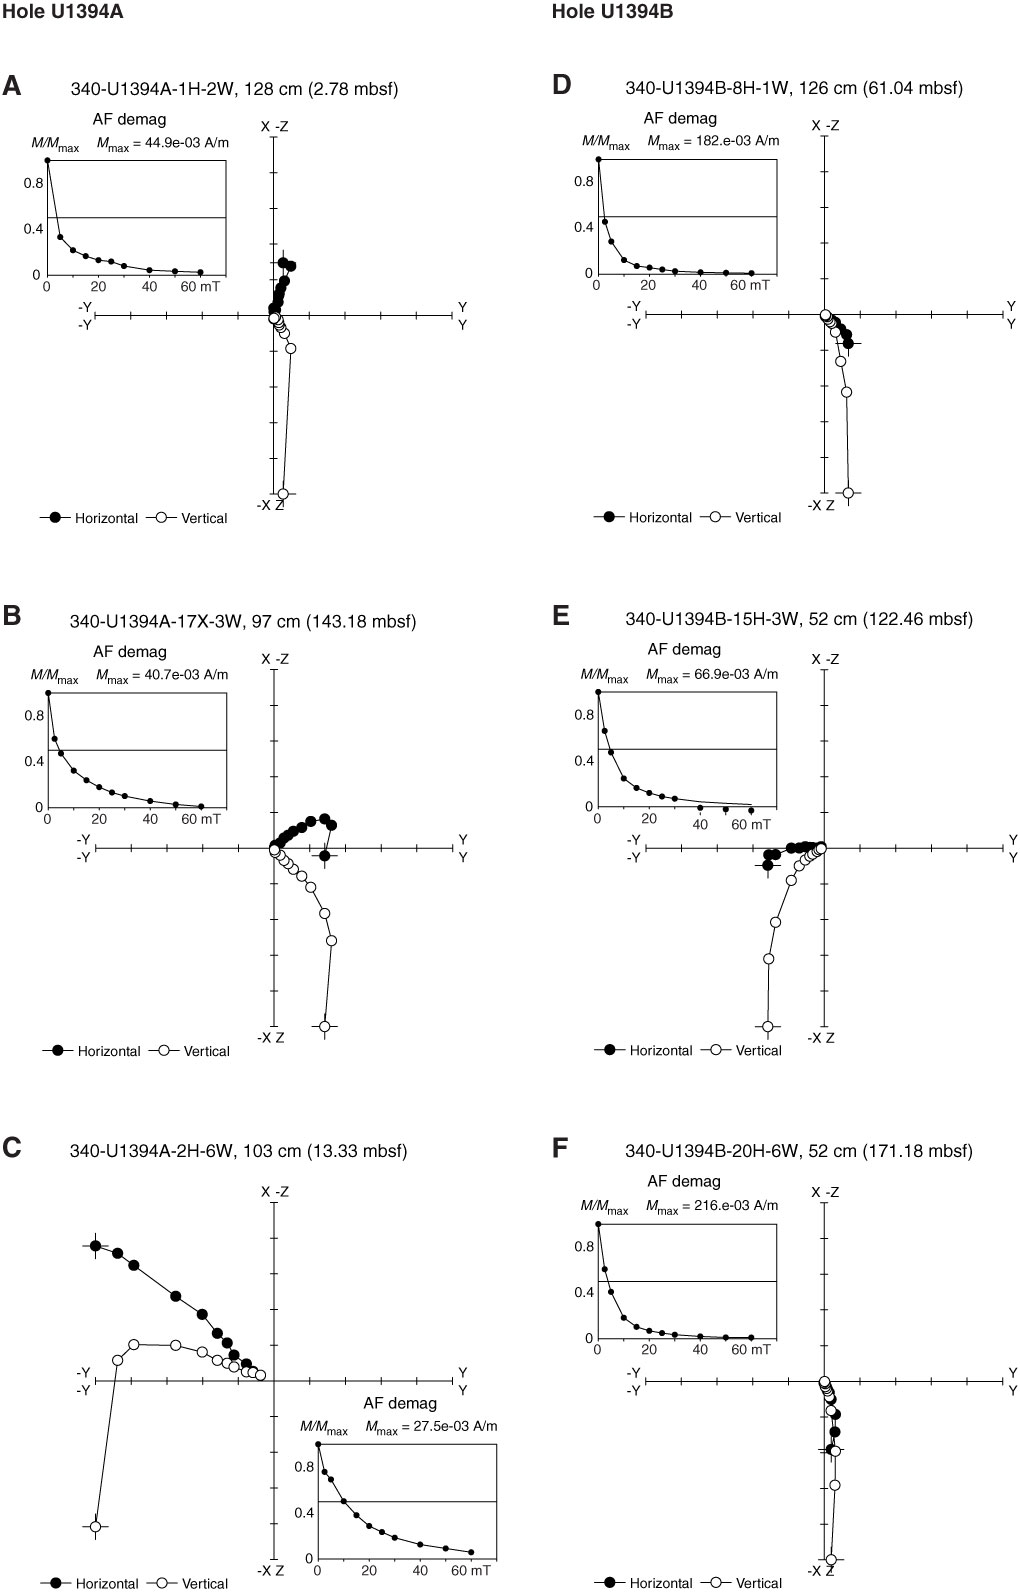
Figure F11. Zijderveld plots for three representative samples each from Holes U1394A and U1394B. Inset shows normalized demagnetization spectra for each sample to 60 mT. AF = alternating field.
Previous | Close | Next | Top of page