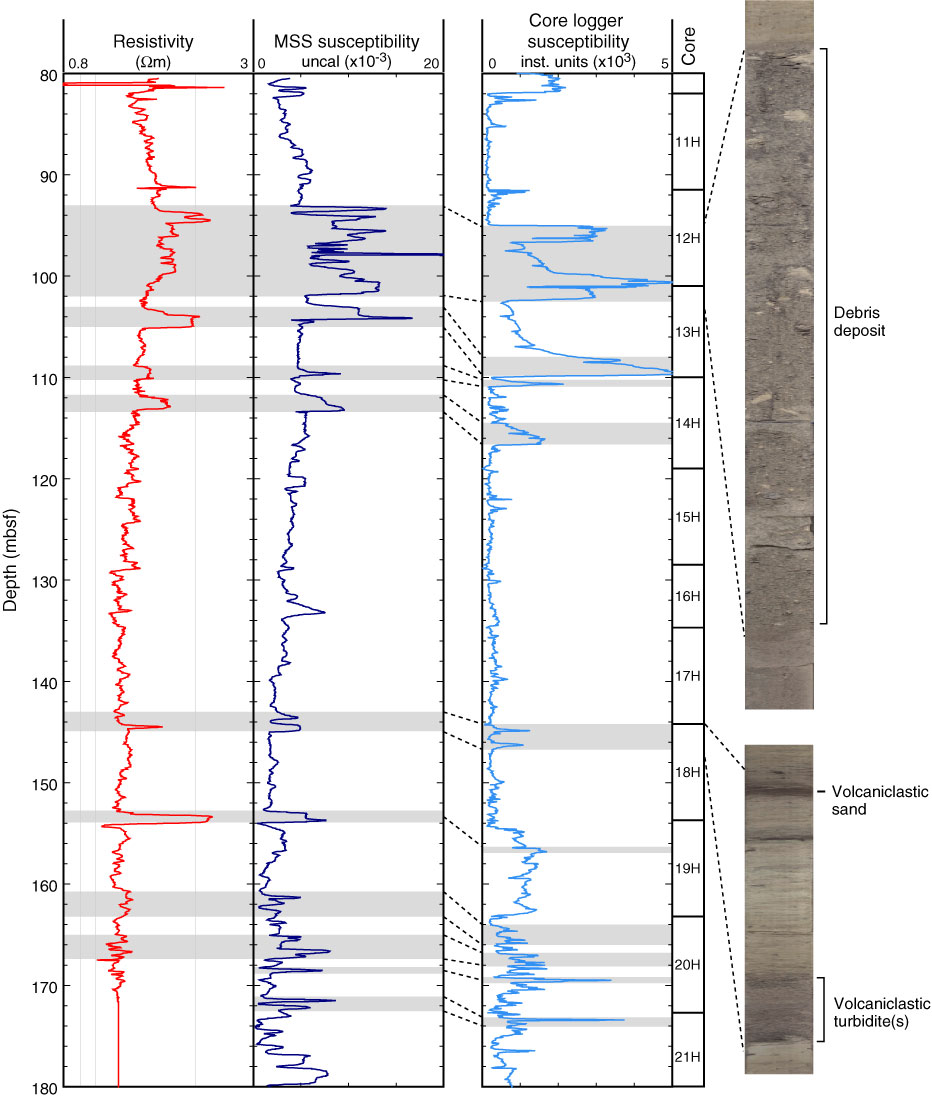
Figure F17. Comparison of magnetic susceptibility recorded with the wireline Magnetic Susceptibility Sonde (MSS) with susceptibility measured on the multisensor loggers, Hole U1394B. Similar features are recorded by the two measurements; however, a clear depth offset between the two data sets increases with distance downhole. Gray bands indicate features that may be correlated between the two data sets, characterized by high electrical resistivity (in logging data) and high magnetic susceptibility (in logging and core data). Examples from core photographs show that some of these features correspond to a debris deposit (Cores 340-U1394B-12H and 13H), volcaniclastic sand, and volcaniclastic turbidites (Core 18H). Core 18H is also shown in a comparison with FMS images for the interval 143.65 through 145.15 mbsf in Figure F18A. uncal = uncalibrated units.
Previous | Close | Next | Top of page