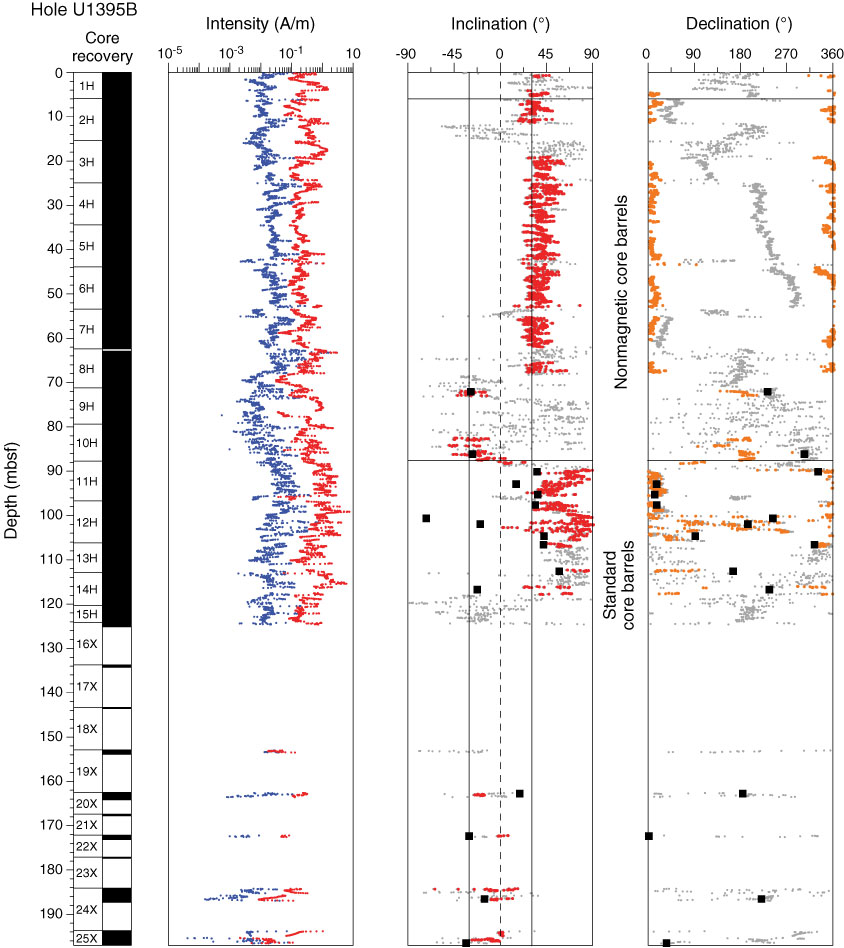
Figure F11. Plots of intensity of NRM0 (red) and NRM20 (blue) and inclination and declination after 20 mT demagnetization, Hole U1395B. For inclination data, gray points are all measurements made and red data are data from hemipelagic sediment. For declination data, gray points are unoriented declinations and orange points are from hemipelagic sediment rotated and guided by discrete inclination data. Black squares are discrete declination and inclination measurements shown against a geocentric axial dipole (GAD) inclination of 30.6°.
Previous | Close | Next | Top of page