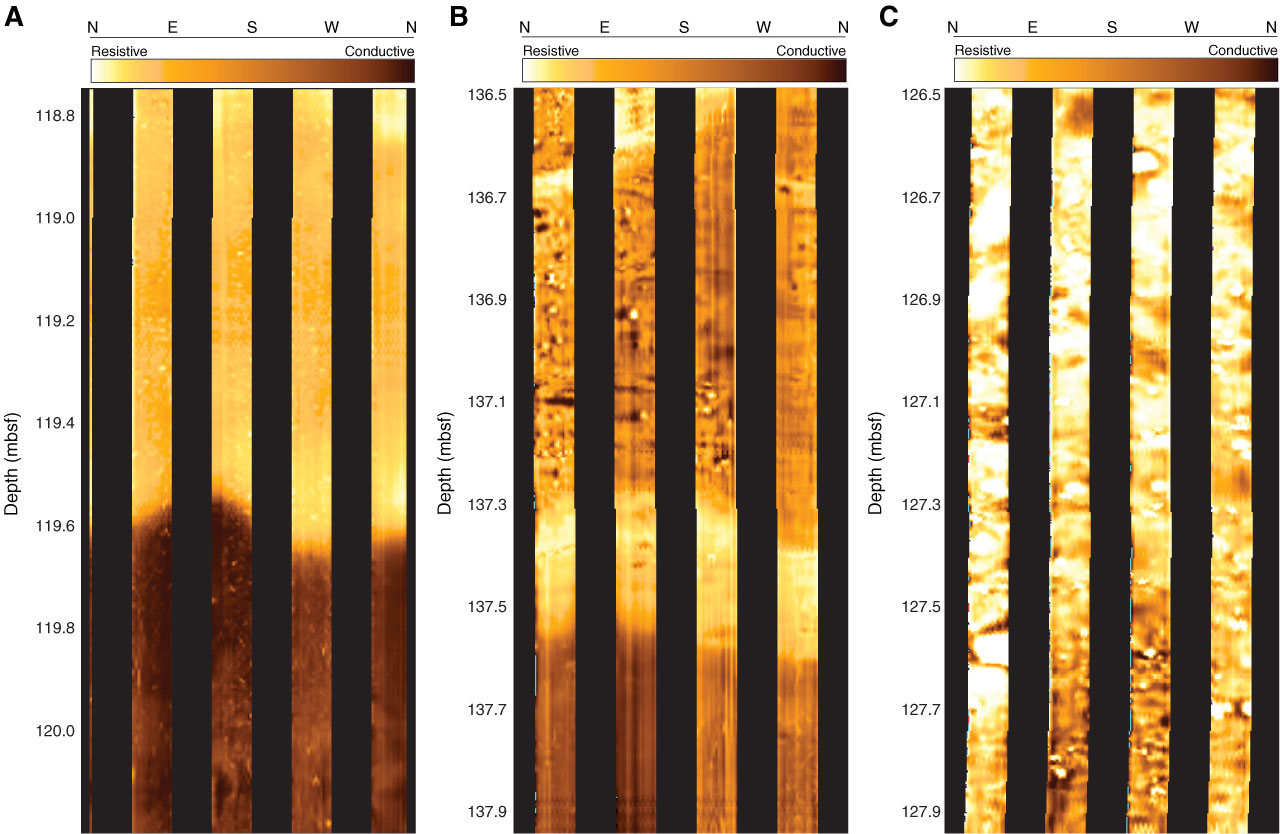
Figure F19. Examples of statically processed FMS images, Hole U1395B. A. Dipping boundary highlighted by the resistivity contrast, logging Subunit 2A. B. Textural variation across a gently dipping boundary, logging Unit 2. C. Textural variation within a highly resistive interval, logging Subunit 2A.
Previous | Close | Top of page