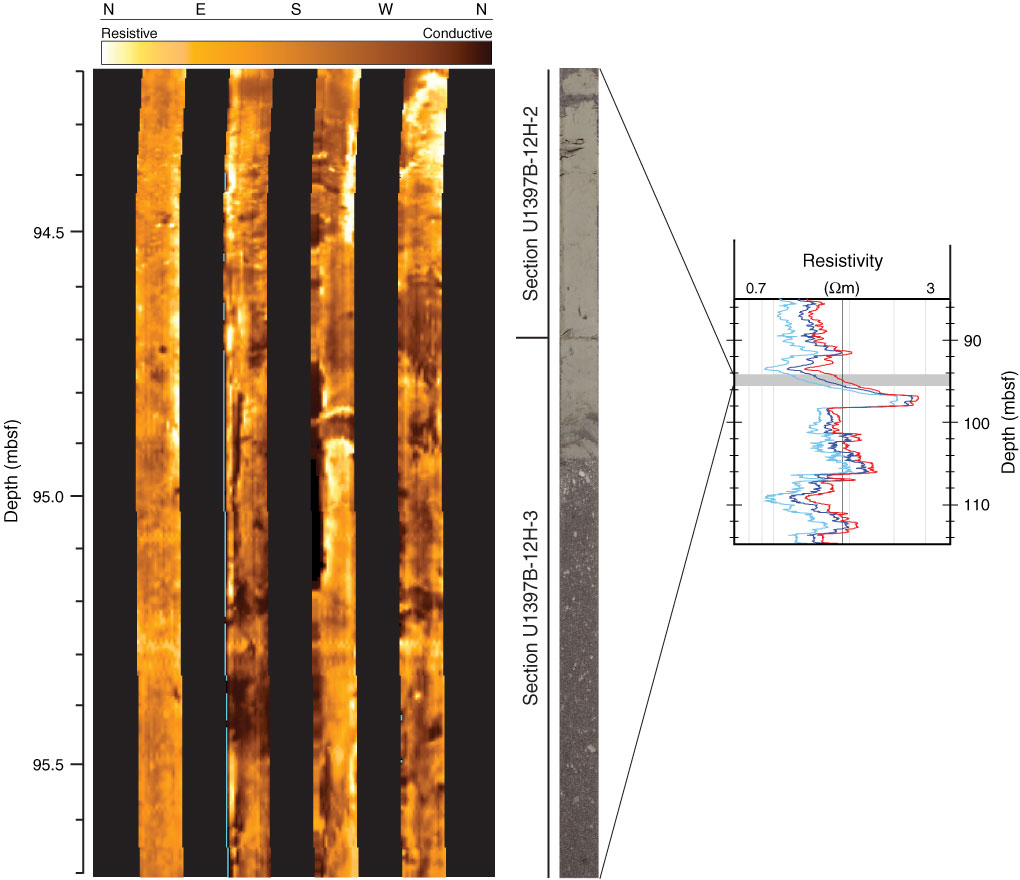
Figure F19. Example of dynamically processed FMS image, Hole U1397B. Image is of a small interval where borehole diameter was small enough to capture some of the electrical properties of the borehole wall. It is shown with the corresponding core, which indicates a distinct change in lithology. This lithological change is not captured in the FMS image but is, however, echoed in the equivalent resistivity log (detail from Fig. F15).
Previous | Close | Top of page