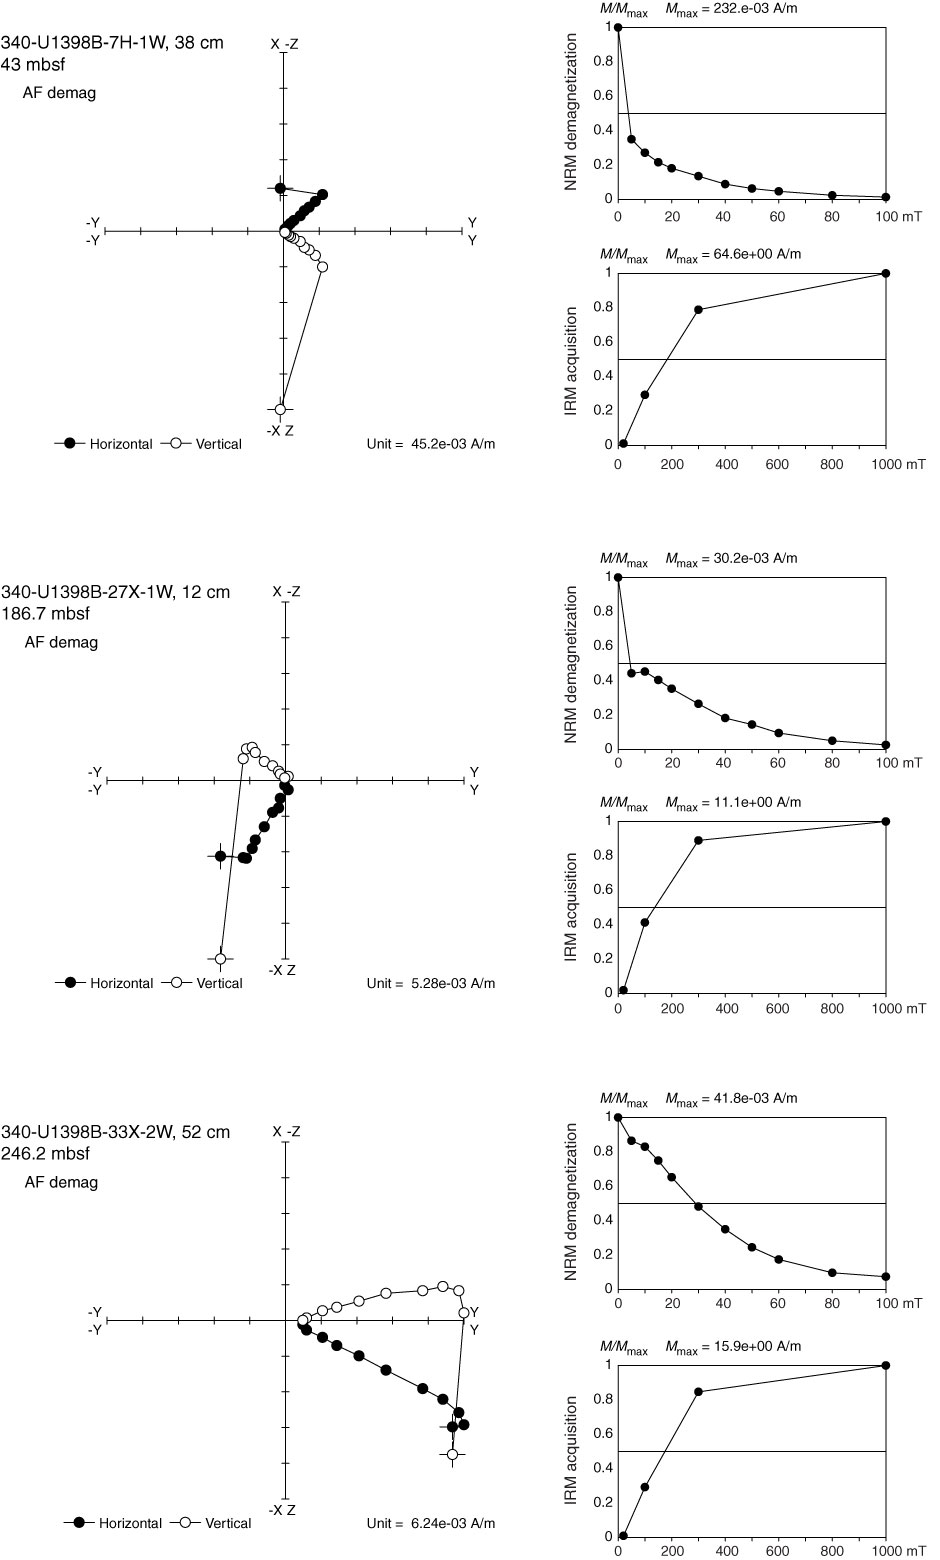
Figure F12. Zijderveld plots, normalized NRM demagnetization curves, and normalized IRM acquisition curves for three discrete samples from Hole U1398B. NRM was demagnetized as high as 100 mT, and then IRM was imparted as high as 1000 mT. AF = alternating field.
Previous | Close | Top of page