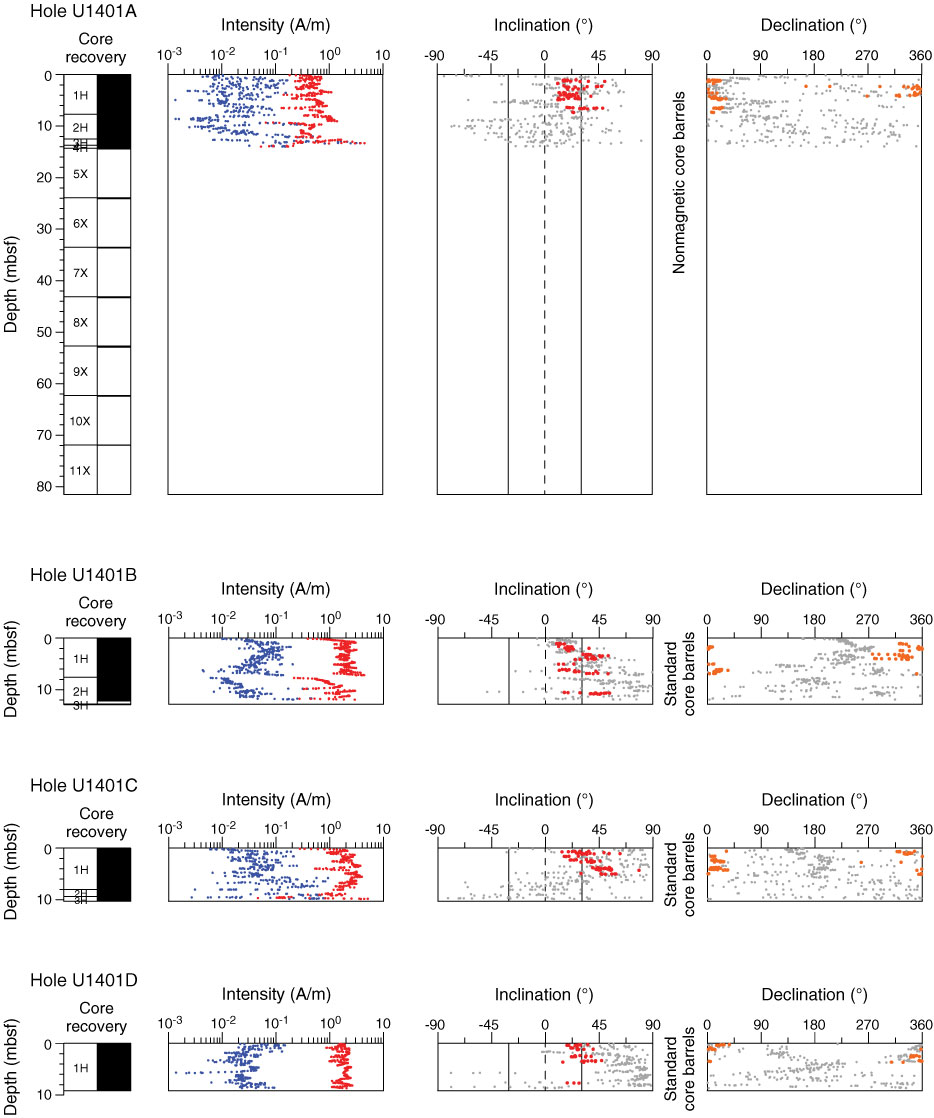
Figure F7. Plots of intensity of NRM0 (red) and NRM20 (blue) and inclination and declination after 20 mT demagnetization, Holes U1401A–U1401D. For inclination data, gray points are all measurements made and red data are measurements made on hemipelagic sediment shown against a geocentric axial dipole (GAD) inclination of 27.6°. For declination data, gray points are all unoriented declination points and orange points are those on hemipelagic sediment rotated to a mean of 0°.
Previous | Close | Top of page