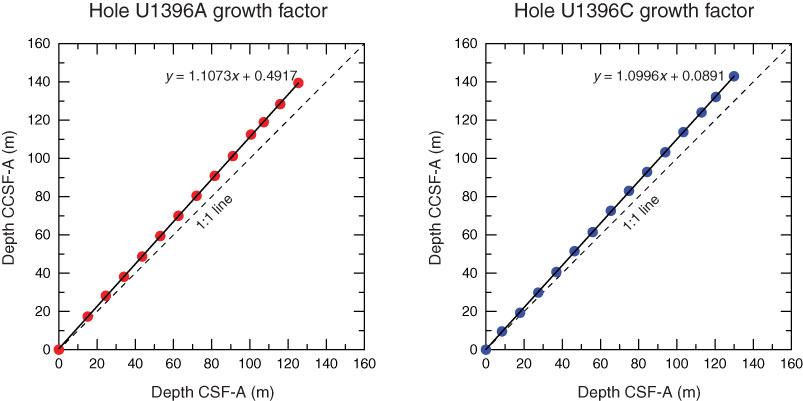
Figure F2. Core top depths for CSF-A vs. CCSF-A, Holes U1396A and U1396C. Lines fit through the core top depths give the relative expansion of the CCSF-A scale relative to the CSF-A scale. Hole U1396A experienced 10.73% growth and Hole U1396C experienced 9.96% growth.
Previous | Close | Next | Top of page