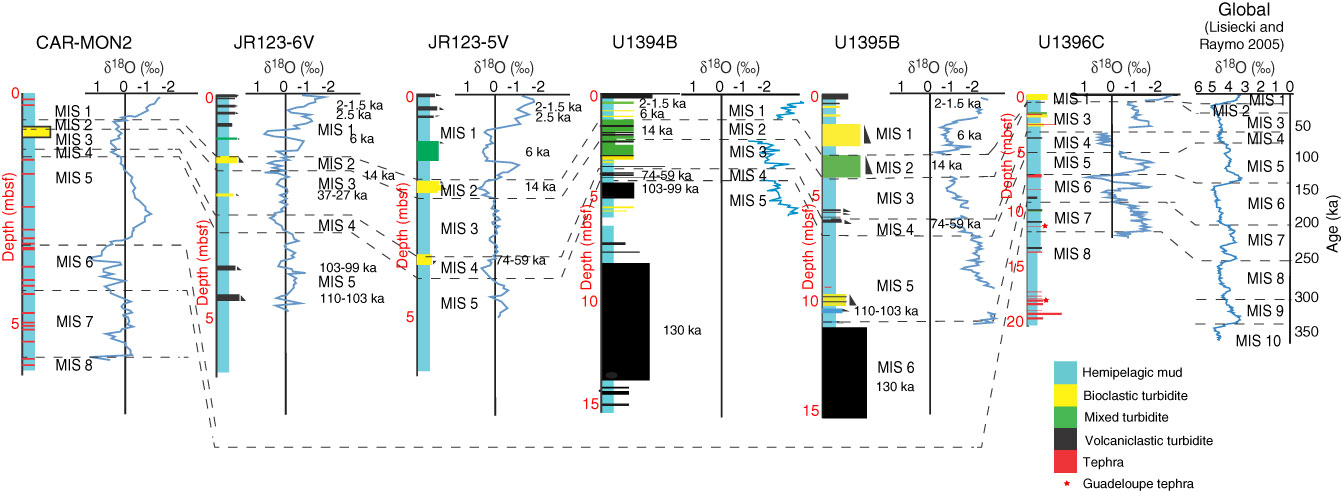
Figure F3. Comparison of oxygen isotope analyses of this study with CAR-MON-2, JR123-6V, JR123-5V (Le Friant et al., 2008; Trofimovs et al., 2013), and the global oxygen isotope curve (Liseicki and Raymo, 2005). Oxygen isotope stages (MIS) are shown. Also shown are unit correlations based on dates and componentry.
Previous | Close | Next | Top of page