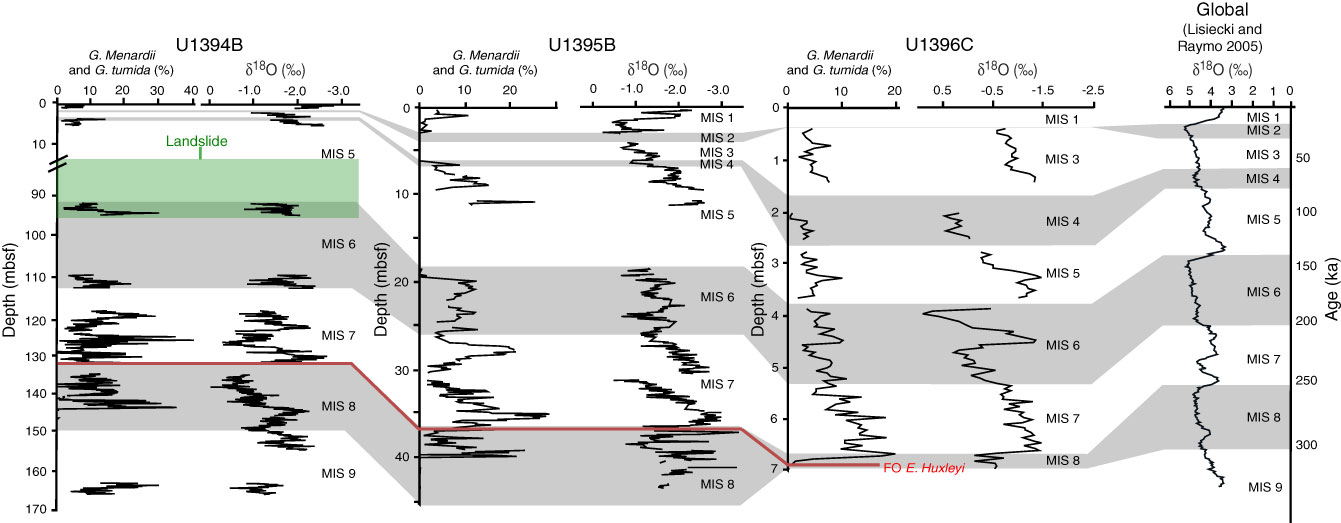
Figure F5. The complete oxygen isotope stratigraphy and percent G. menardii shown for Holes U1394B, U1395B, and U1396C with glacial periods shaded in gray. Also shown is the global oxygen isotope curve (Liseicki and Raymo, 2005). The red line indicates the first occurrence of E. huxleyi. The green box on Hole U1394B identifies a section of stratigraphy that is part of a landslide, thus is not in situ.
Previous | Close | Top of page