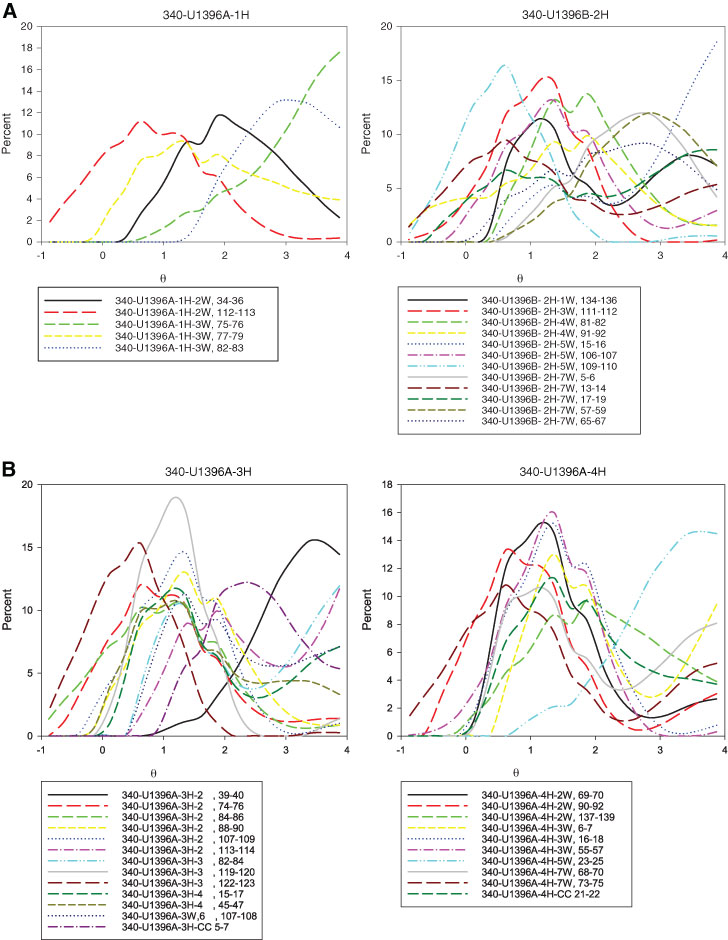
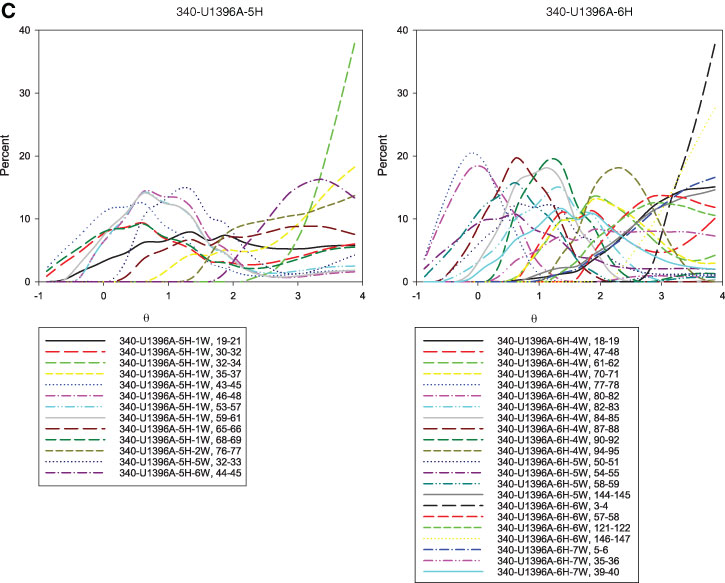
Figure F2. A–C. Grain size distribution plots for each of the visible tephra layers analyzed in Cores 340-U1396A-1H and 3H through 6H and Core 340-U1396B-2H. Data generated by a Malvern Mastersizer 2000 particle size analyzer.
Previous | Close | Top of page