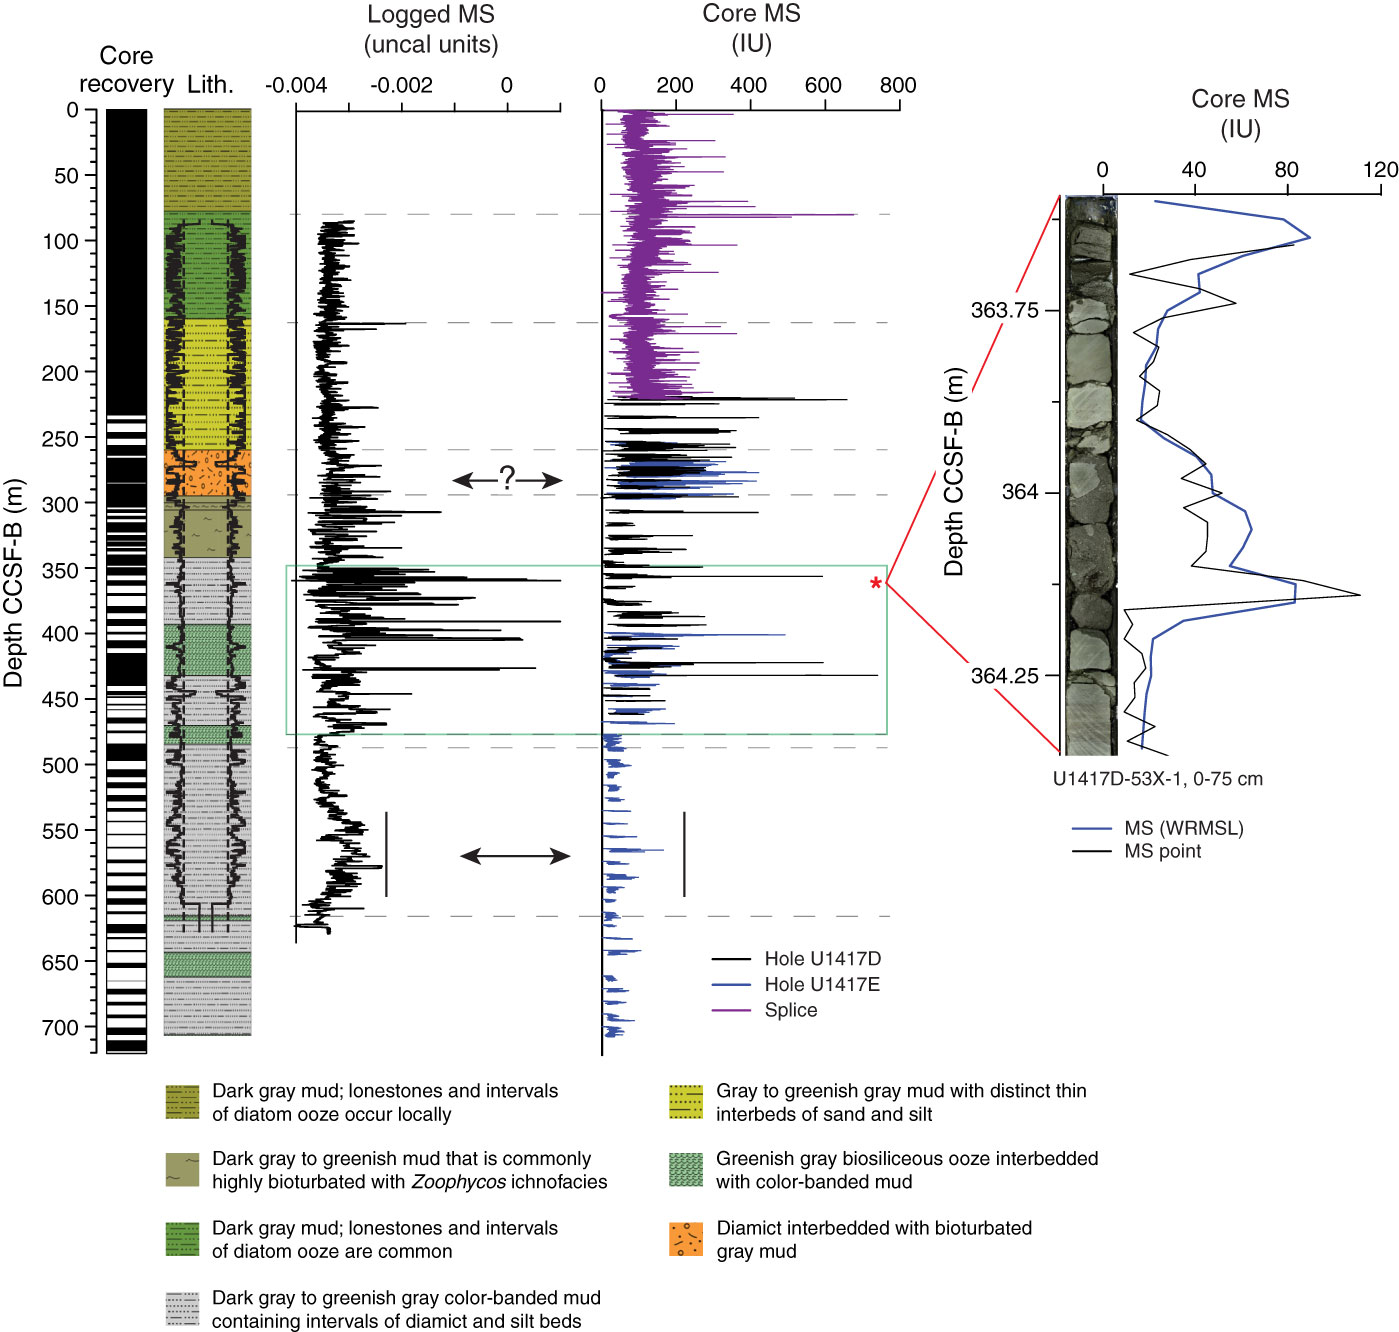
Figure F37. Lithostratigraphic units, borehole size, and core recovery, Site U1417. Magnetic susceptibility (MS) data were measured during downhole logging in Hole U1417E and on cores. Green box = interval of clast-rich and clast-poor diamict interbedded with mud where magnetic susceptibility is highest and most variable in the logging data. Horizontal dashed lines = transitions between lithostratigraphic units. The inset figure highlights the correlation between diamict intervals and high magnetic susceptibility values in the core data. The core image shows Section 341-U1417D-53X-1, 0–75 cm, the red star denotes its position. The inset figure provides evidence for the diamict intervals causing high magnetic susceptibility values in the logged data. A difference of as much as ~10 m may exist when comparing the CCSF-B and WMSF depth scales. WRMSL = Whole-Round Multisensor Logger.
Previous | Close | Next | Top of page