Previous | Close | Next
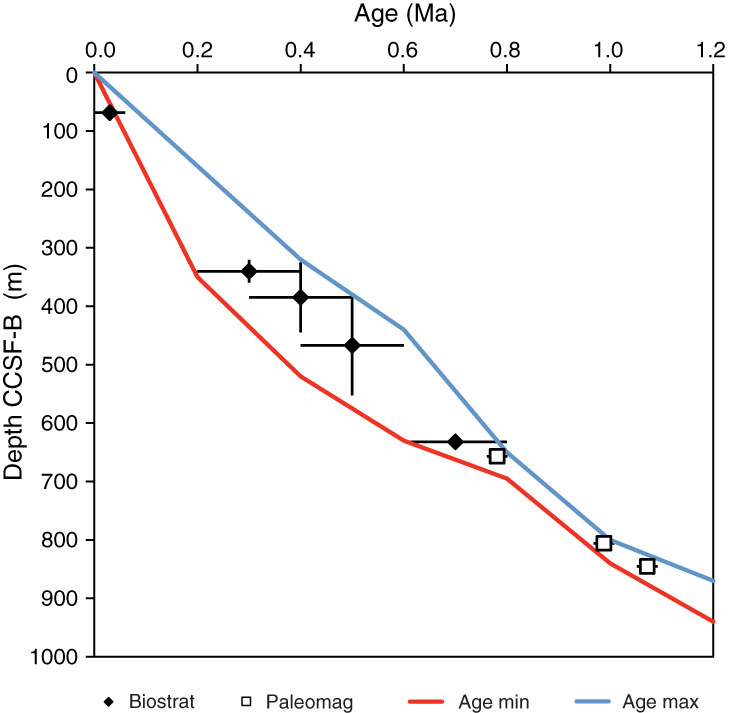
Figure F43. Shipboard age model, Site U1418. The two dashed curves represent the minimum and maximum initial age models described in the text.
Previous | Close | Next | Top of page