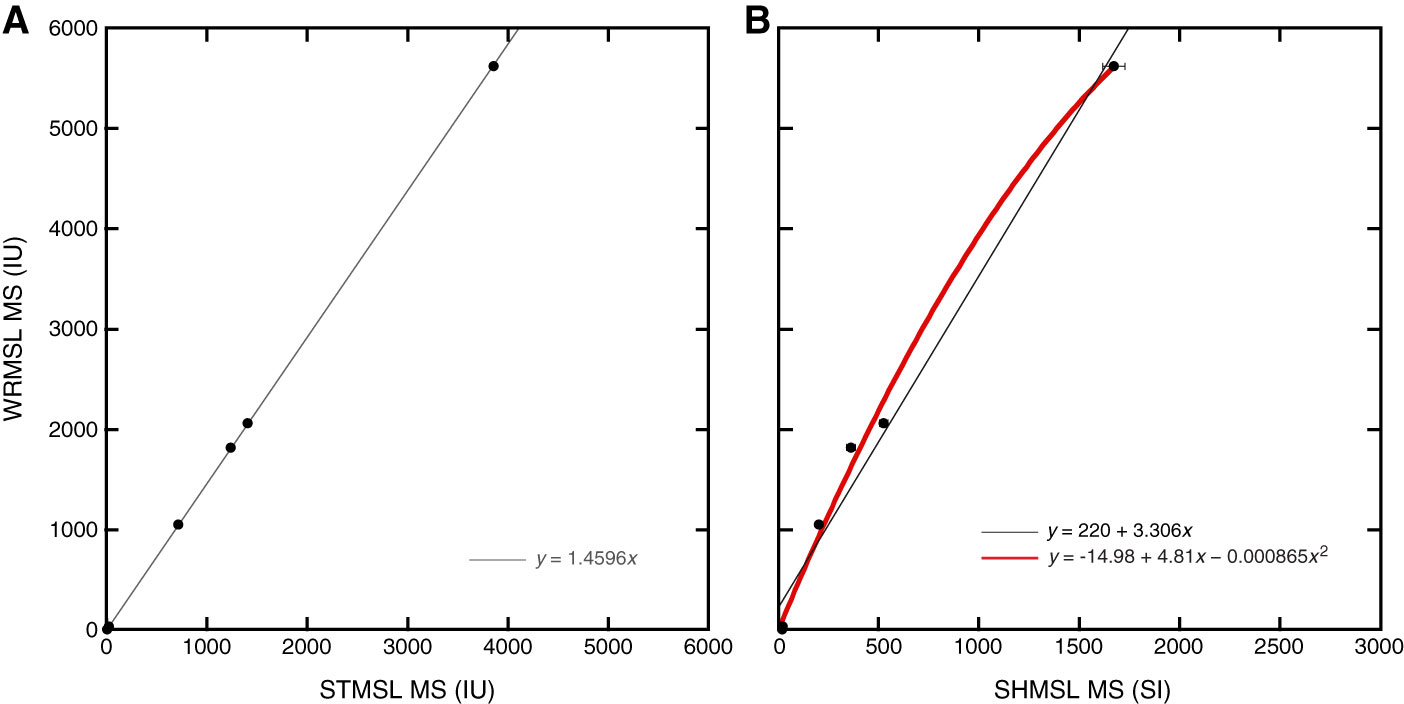
Figure F20. Relationship between Whole-Round Multisensor Logger (WRSML), Special Task Multisensor Logger (STMSL), and Section Half Multisensor Logger (SHMSL) magnetic susceptibility (MS) calculated from 6 standards. Each 30 cm standard was run through all three instruments at 0.5 cm resolution three times, and the central 20 cm were averaged to generate a single value for each run. The averages of the three runs for each standard are plotted with 1σ standard deviations for (A) STMSL vs. WRMSL and (B) SHMSL vs. WRMSL. The standard deviations of these three runs are plotted on both axes but fall within the symbol in the case of the loop MS data. In the case of the WRMSL vs. SHMSL data, both a linear regression (black) and a second-order polynomial regression (red) are shown.
Previous | Close | Next | Top of page