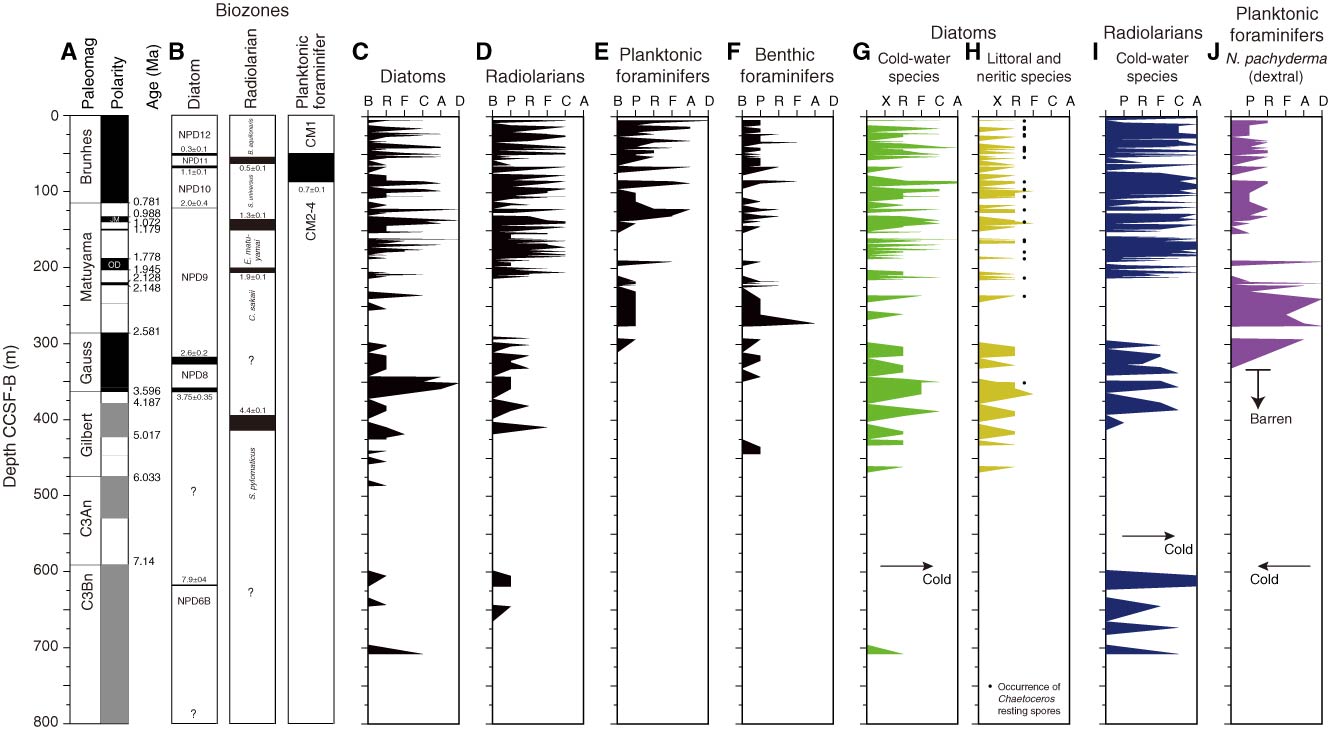
Figure F19. Micropaleontological age datums, group abundances (black plots), and rank abundances (color plots) of important paleoenvironmental indicators, shown as a composite of Holes U1417A–U1417E. Diatoms are plotted using the highest of individual species abundances within each species suite, estimated from the number of valves per field of view. Rank abundance of cold-water radiolarians is estimated from the proportional abundances of cold-water species in the total radiolarian assemblage. Rank abundance of Neogloboquadrina pachyderma (dextral), a warm-water indicator, is estimated from its proportional abundance in the total foraminiferal assemblage. NPD = Neogene North Pacific Diatom zone of Yanagisawa and Akiba (1998), CM = California margin. Abundance: D = dominant, A = abundant, C = common, F = few, R = rare, P = present, X = present, B = barren.
Previous | Close | Next | Top of page