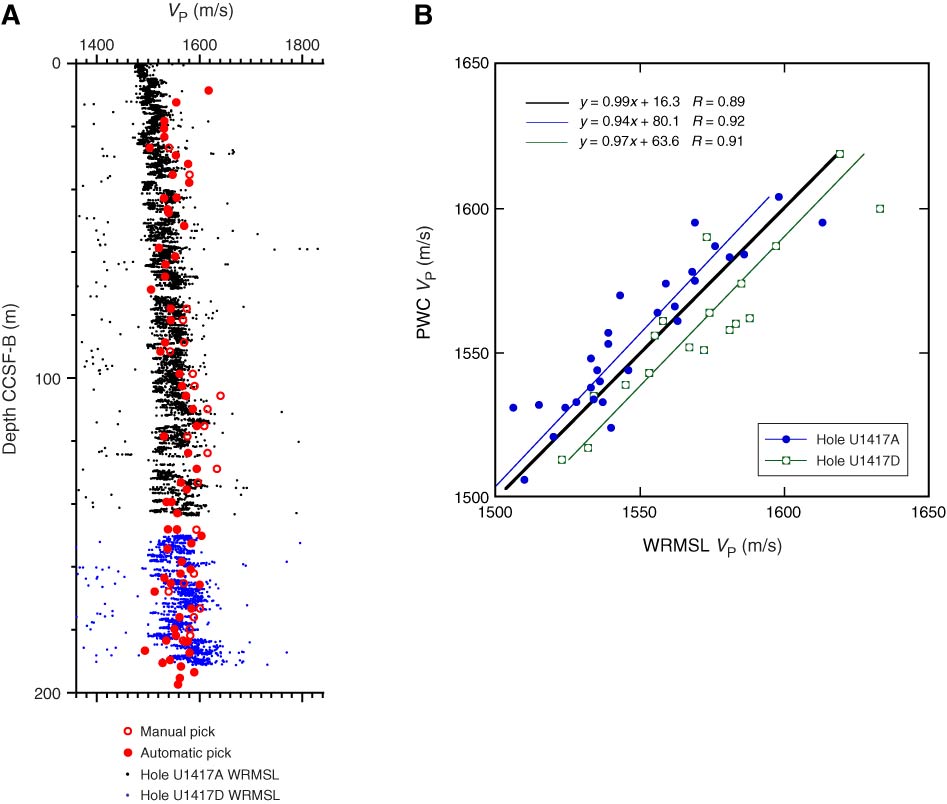
Figure F40. P-wave velocity measured by the Whole-Round Multisensor Logger (WRMSL) on whole-round sections and the P-wave caliper (PWC) on working half sections. A. Combined plot. B. Scatter plot, showing correlation between core logger and discrete measurements. The black trend line reflects all values from Holes U1417A and U1417D.
Previous | Close | Next | Top of page