Previous | Close | Next
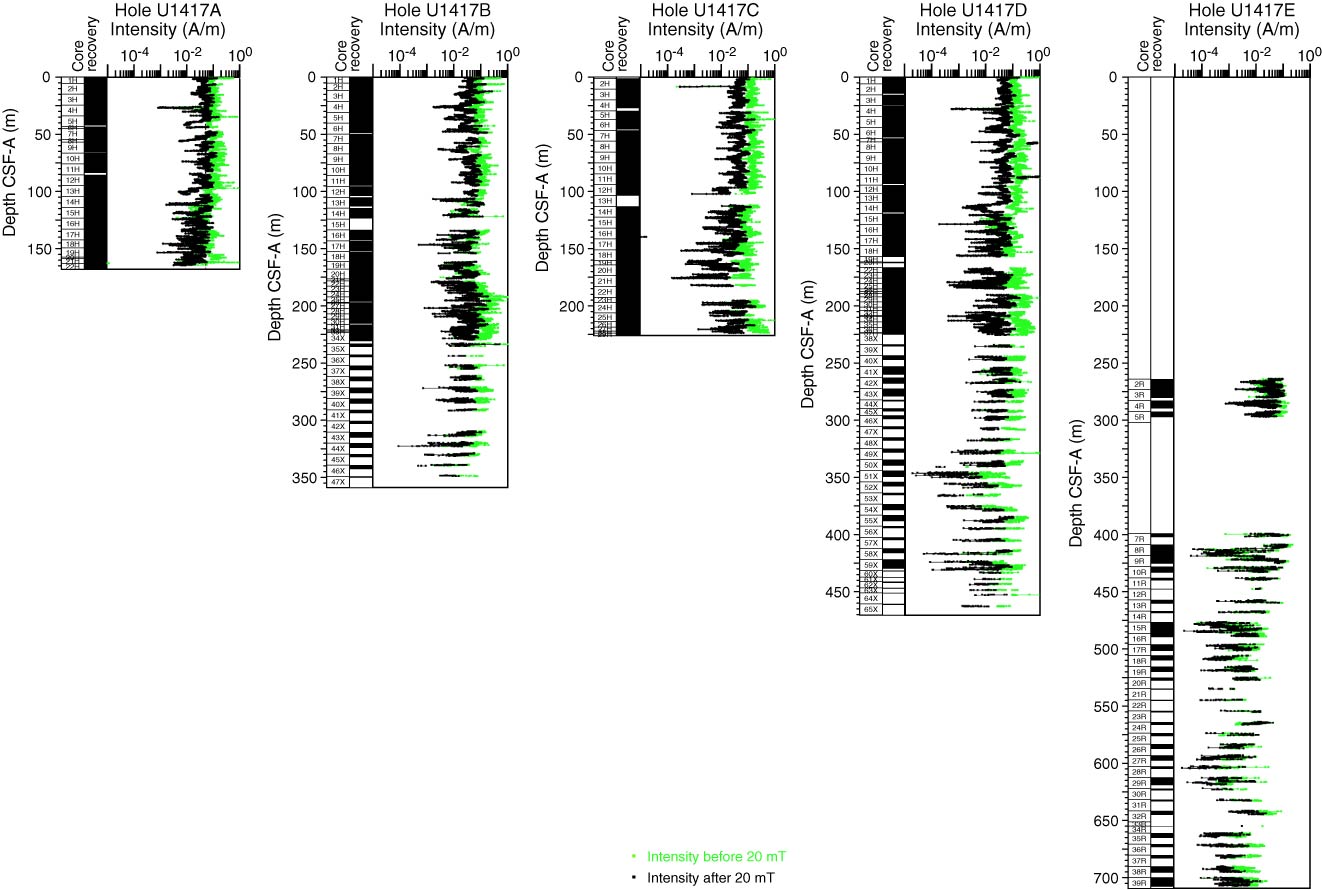
Figure F48. Natural remanent magnetization intensity plotted on a log scale before and after 20 mT peak alternating field demagnetization in recovered APC, XCB, and RCB intervals, Site U1417.
Previous | Close | Next | Top of page