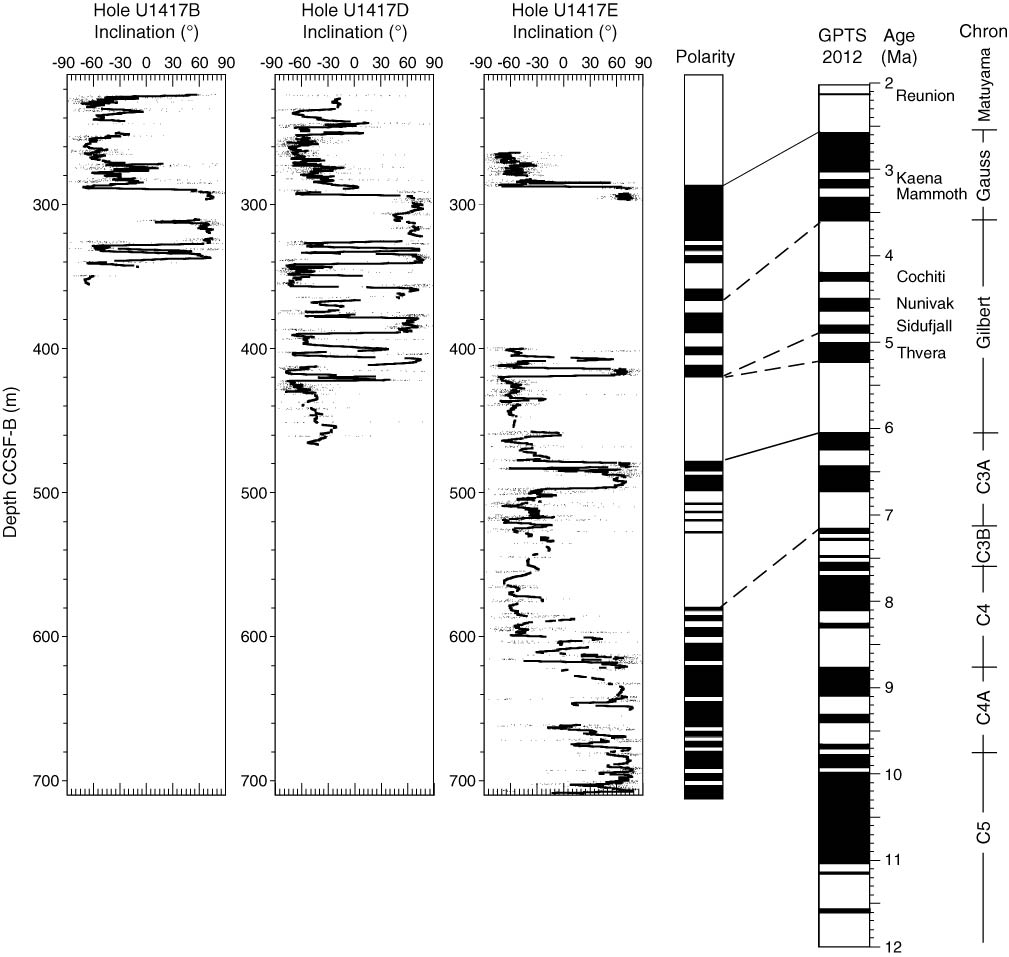
Figure F50. Inclination and polarity interpretations after peak alternating field demagnetization (20, 30, or 40 mT) in recovered XCB intervals of Holes U1417B and U1417D, and the recovered RCB interval of Hole U1417E. The smoothed line (50 cm running mean) is derived from expanded data that attempts to account for poor core recovery. See “Paleomagnetism” for explanation of expansion methodology. The geomagnetic polarity timescale (GPTS) on the geological timescale is shown for reference (Hilgen et al., 2012).
Previous | Close | Next | Top of page