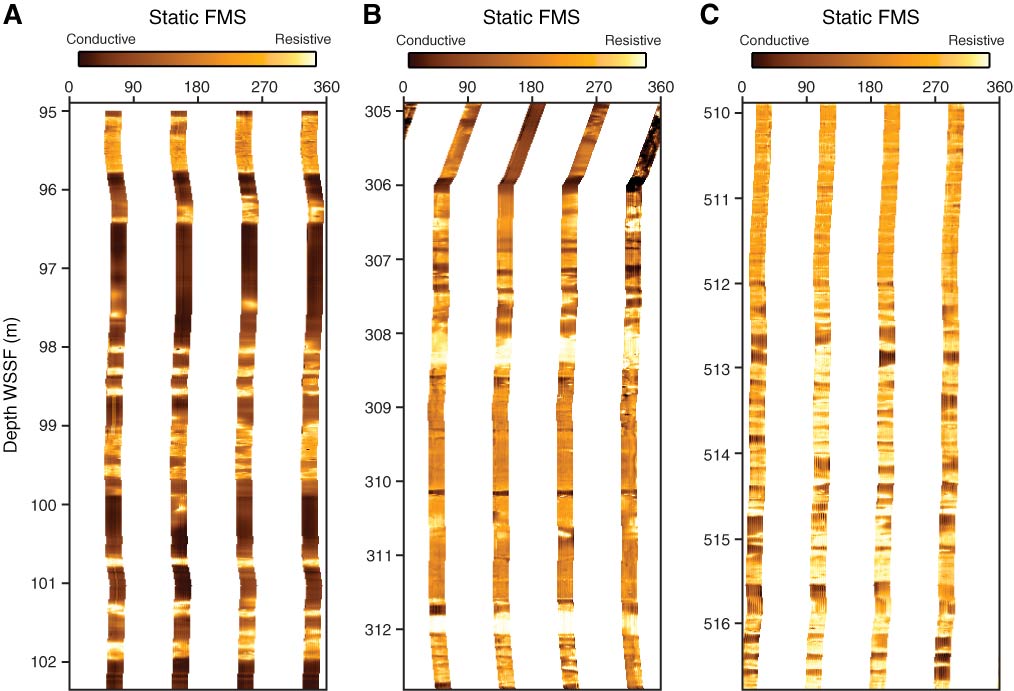
Figure F56. Examples of statically processed Formation MicroScanner (FMS) images from FMS-sonic Pass 1, Hole U1417E. Images show typical resistivity features and textures from (A) ~95 to 102 m WSSF in logging Unit 1, (B) ~305 to 312 m WSSF in logging Subunit 2A, and (C) ~510 to 516 m WSSF in logging Subunit 2B. See “Downhole logging” in the “Methods” chapter (Jaeger et al., 2014) for explanation of WSSF depth scale.
Previous | Close | Next | Top of page