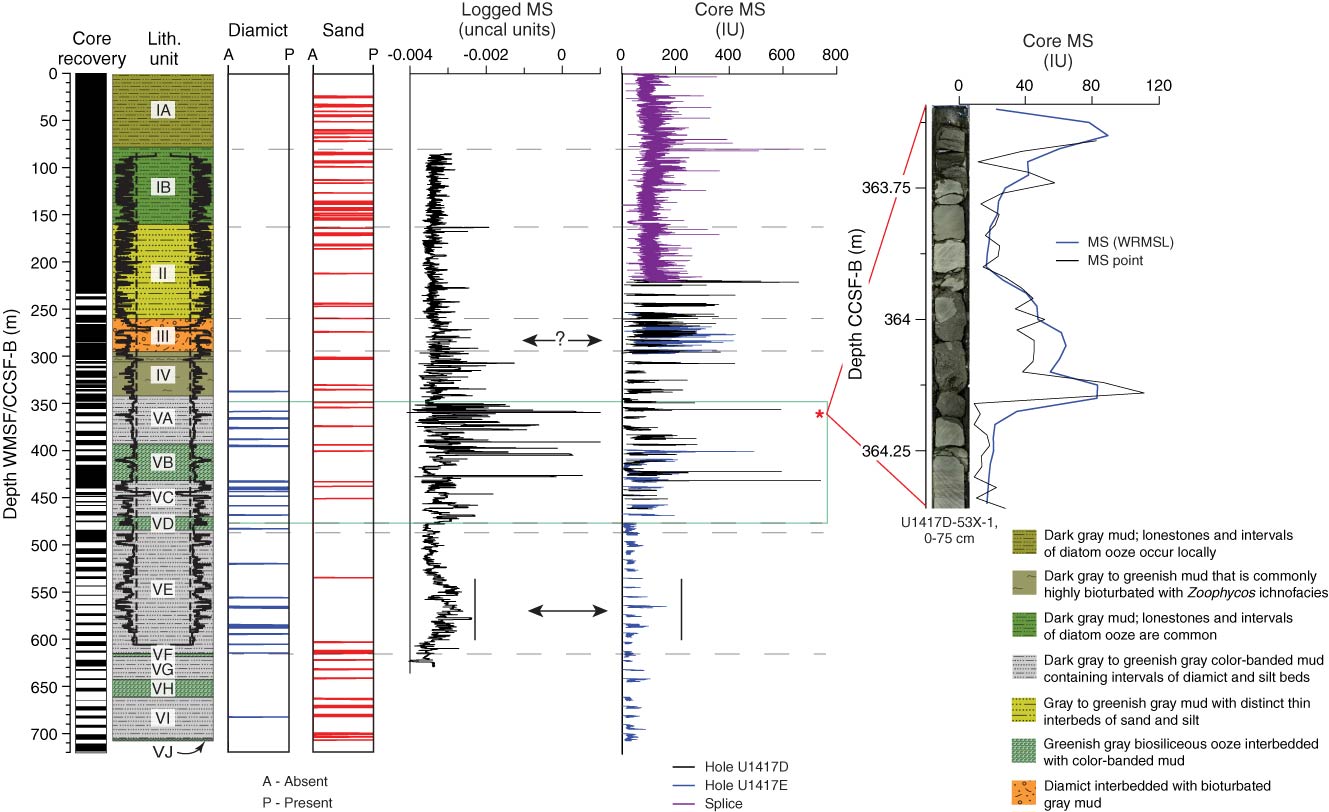
Figure F58. Comparison of core and logging magnetic susceptibility (MS), Site U1417. Diamict and sand are combined observations from Holes U1417A–U1417E, and logging data are from Hole U1417E. Green rectangle = interval of diamict interbedded with mud where MS is highest and most variable in logging data. Horizontal dashed lines = lithostratigraphic unit boundaries. Inset figure highlights correlation between diamict and high MS values in the core data. Red star = position of core image in overall stratigraphy. Overall, inset figure provides evidence for the diamict intervals causing high MS values in logging data. Up to ~10 m difference may exist when comparing the CCSF-B and WMSF depth scales. WRMSL = Whole-Round Multisensor Logger.
Previous | Close | Next | Top of page