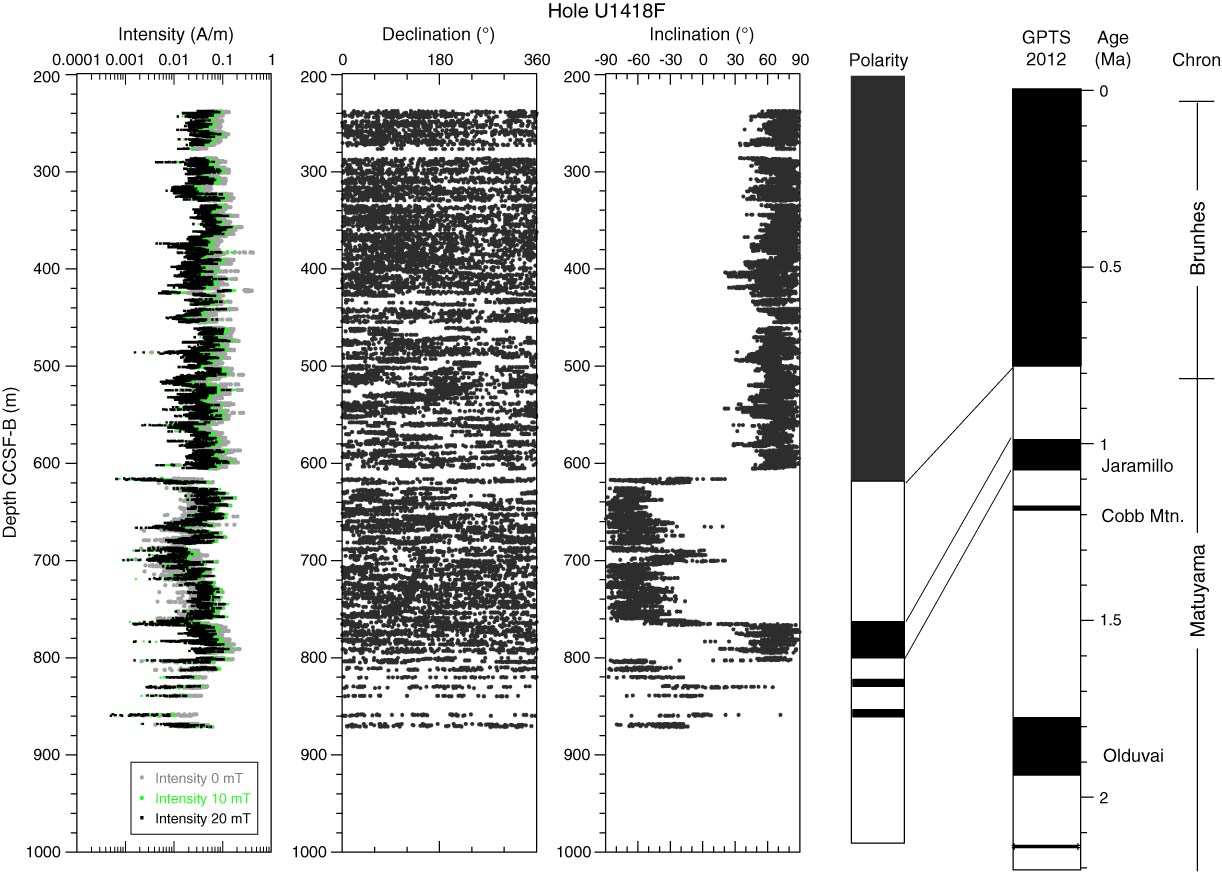
Figure F20. Intensity measured before and after 10 and 20 mT AF demagnetization and declination and inclination measured after 20 mT peak AF demagnetization for Hole U1418F. Polarity interpretation and correlation to the geomagnetic polarity timescale (GPTS) on the geological timescale 2012 (Hilgen et al., 2012) is shown and developed in the text (see “Paleomagnetism”). The deepest three cores (341-U1418-70R through 72R) containing a mass transport deposit are not included, though intensities are similar to those of the sediment above.
Previous | Close | Next | Top of page