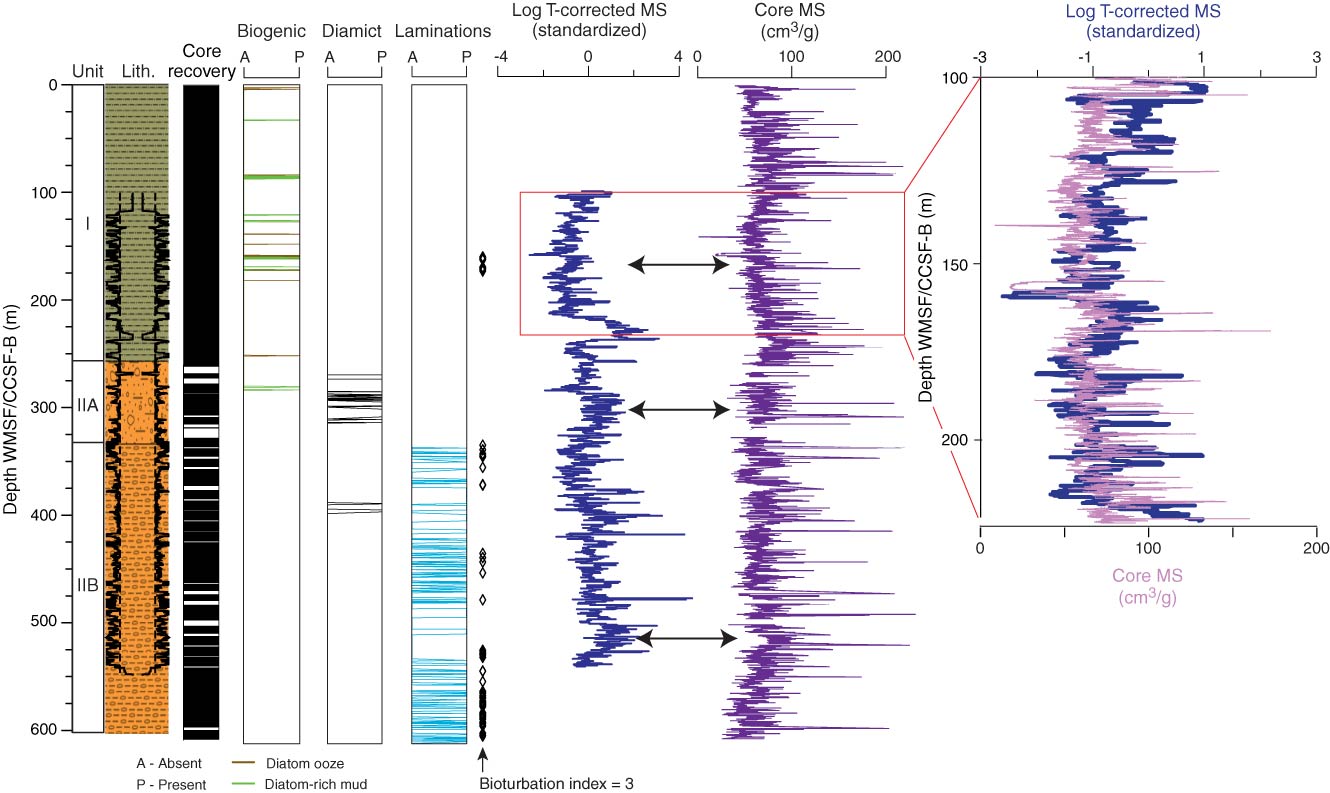
Figure F55. Comparison of core and logging magnetic susceptibility (MS), Site U1418. Diamict, diatom ooze, diatom-rich mud, laminations, and bioturbation are combined observations from Holes U1418A–U1418F and are compared to MS data measured during downhole logging in Hole U1418F (blue curve) and on cores (purple curve from integrated measurements made on splices). Downhole logging MS data are smoothed over a 40 cm sliding average and are temperature corrected (T-corrected). Core MS has been smoothed over a 2.5 cm window and then volumetrically corrected. The inset diagram shows the close correspondence between core and logging MS between 100 and 225 m CCSF-B/WMSF.
Previous | Close | Next | Top of page