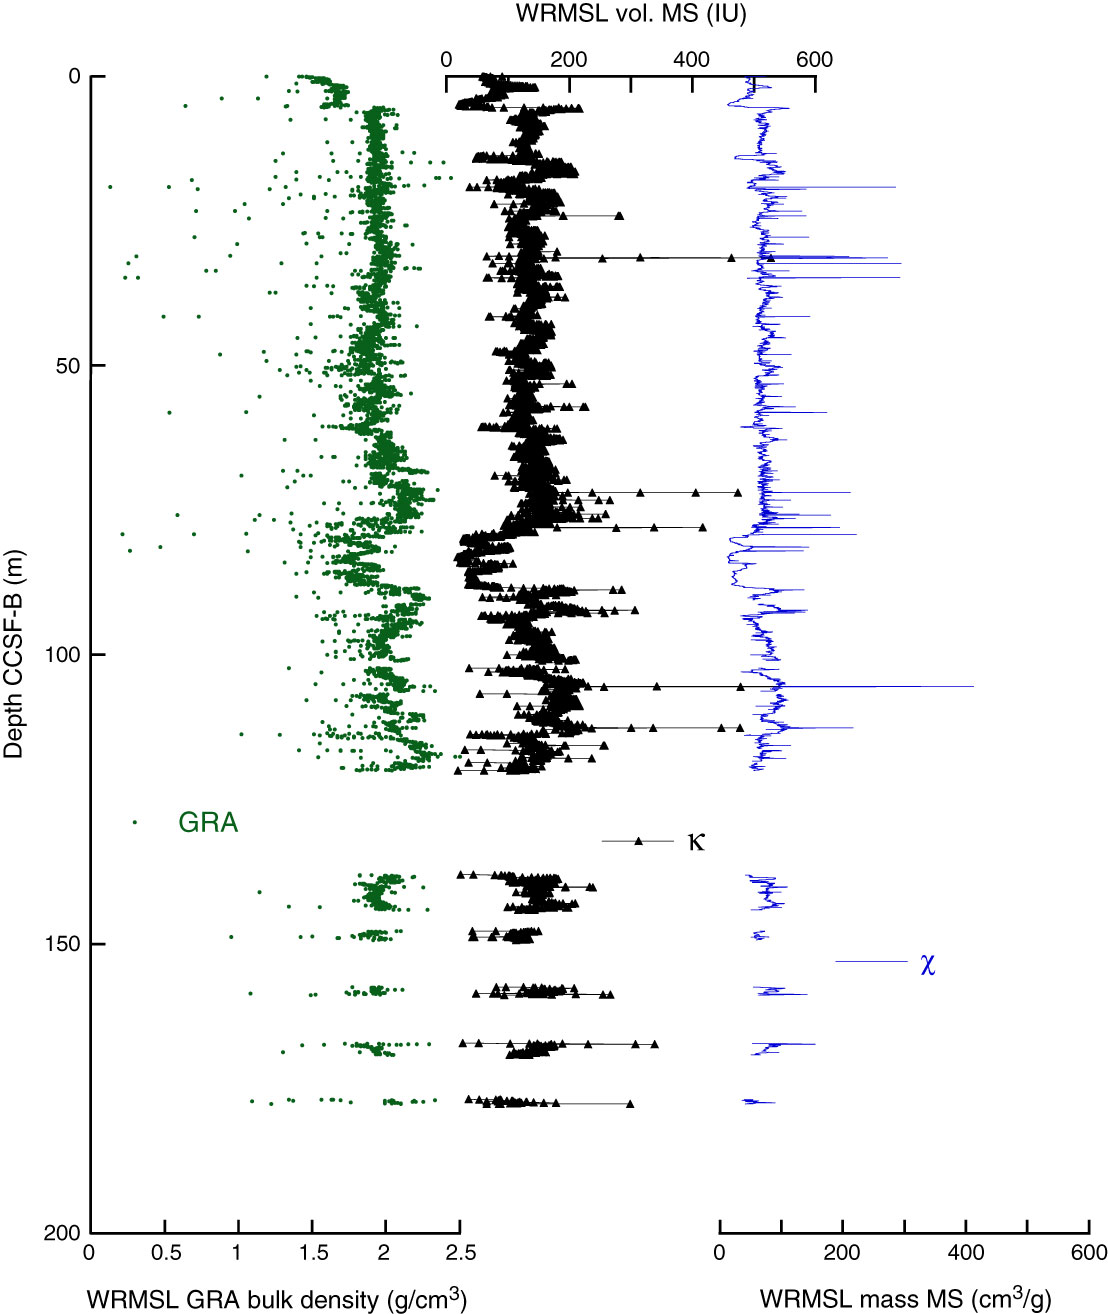
Figure F28. Whole-Round Multisensor Logger (WRMSL) gamma ray attenuation (GRA) bulk density compared to WRMSL magnetic susceptibility (MS) data, Site U1419. Both data sets are shown after Gaussian smoothing with a 10 cm window (±3σ) and interpolation to constant resolution at 2.5 cm. WRMSL MS (κ; black) is also shown corrected for variability in recovered sediment volume by normalizing to WRMSL GRA bulk density, generating mass MS (χ; blue). Data in the upper 90 m CCSF-B reflect the stratigraphic splice (see “Stratigraphic correlation”); deeper data from cores in Holes U1419A, U1419C, and U1419D are combined. In this lower interval, when depth horizons were recovered in multiple holes we use an average of all available interpolated data.

Previous | Close | Next | Top of page